Helical Insight 2.0 IS HERE
Helical Insight 2.0 is here with more than 30 plus improvements and changes which includes performance enhancement, UX revamping, direct out of the product support for many functionalities, keyboard shortcuts, voice and text search, exporting options and many more. Read further to know more. Version 2.0 is going to be followed up by release 2.1 and 2.2 very shortly.
Features

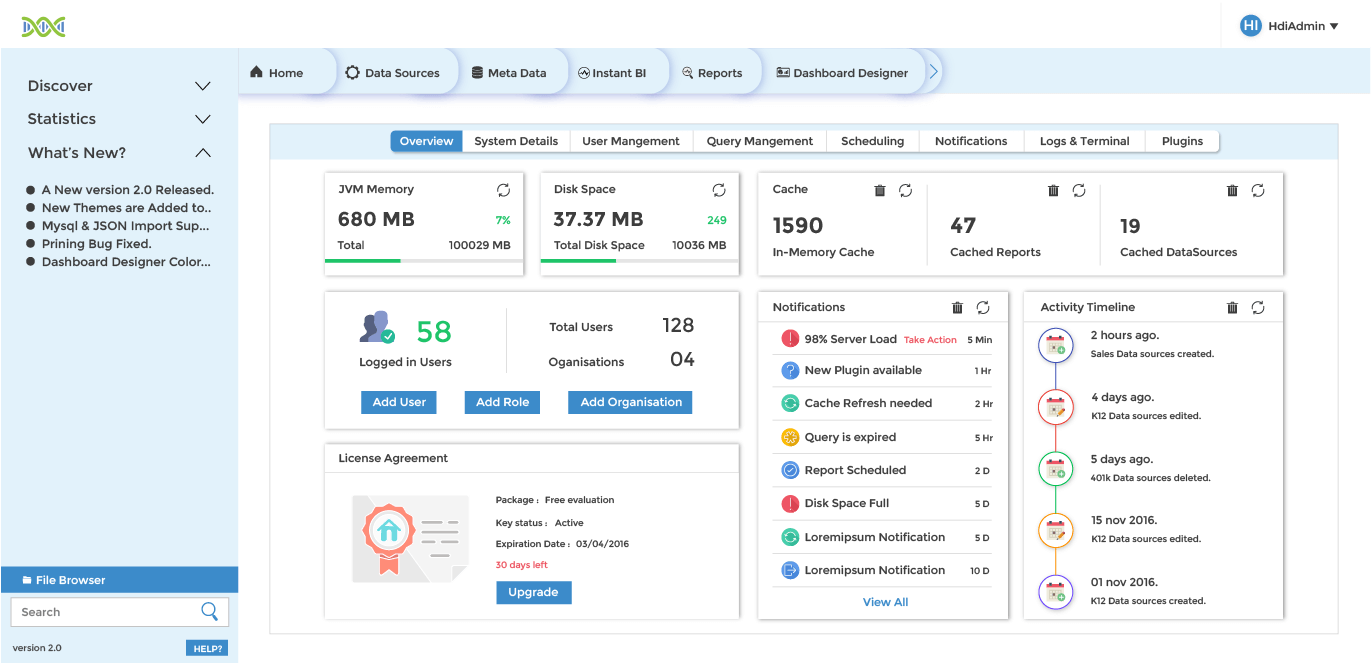
Next Generation UX
Helical Insight 2.0 comes with a completely revamped UI with absolutely wonderful user experience. No functionality is now more than 2 clicks away.

Performace Enhancement
With pagination and performance enhancement functionality even fetching millions of records will not take time. End users will start seeing the data while more and more data is being populated.

Voice and Text Search
Search for reports, dashboards or trigger functionality via voice or text. Voice commands can also be enabled or disabled.
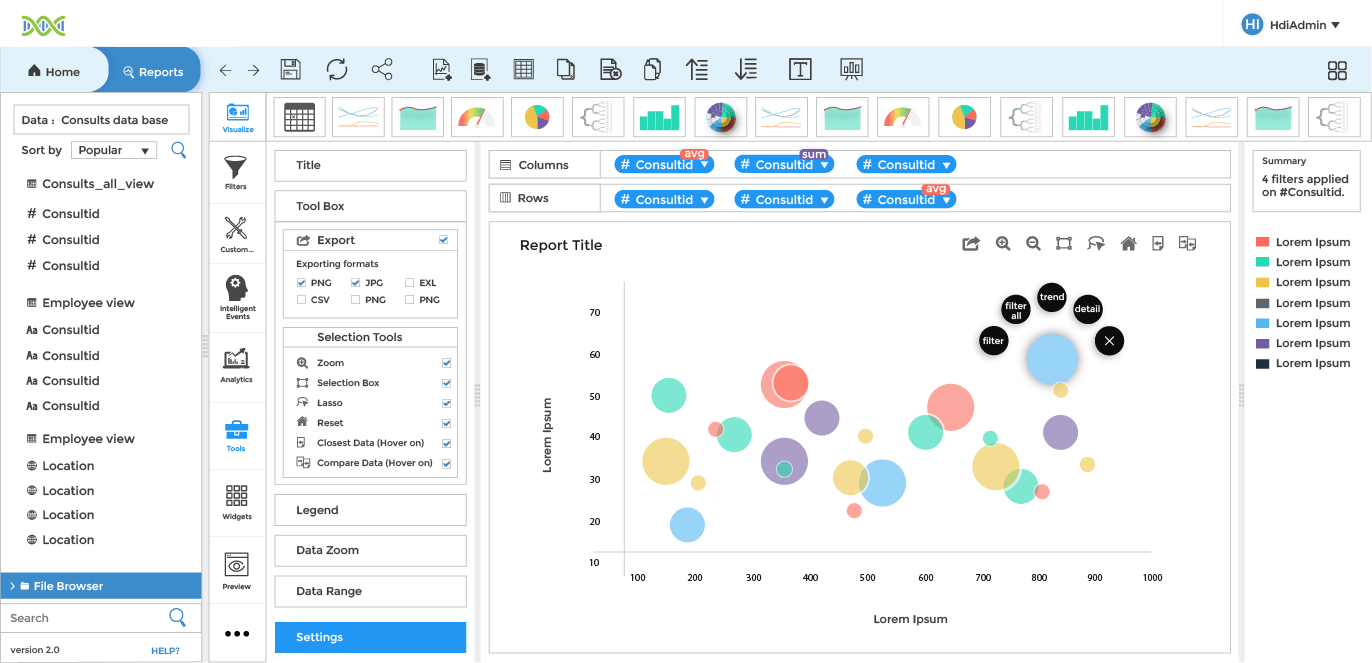
Adhoc Reports

More charting options
With many more inbuilt charting options like grouped charts, timeseries chart, radar chart, polar chart etc you have more options allowing you to analyze your date. Also, if you have HTML knowledge then you can add Any JavaScript chart into Helical Insight platform.

UI driven chart customization
Now do any sort of customizations in charts, table, crosstab from Adhoc UI itself. Hence, things like customizations of color, labels, legends, prefix, suffix, transparency, opacity, text formatting, tooltip and many more can be done by merely clicking on mouse. You can also add your own report customizations also.

Filtering
Filtering capabilities has been taken to a new level by extensive filtering options, advanced expressions usage, date and time usage as a filter at any aggregate level.
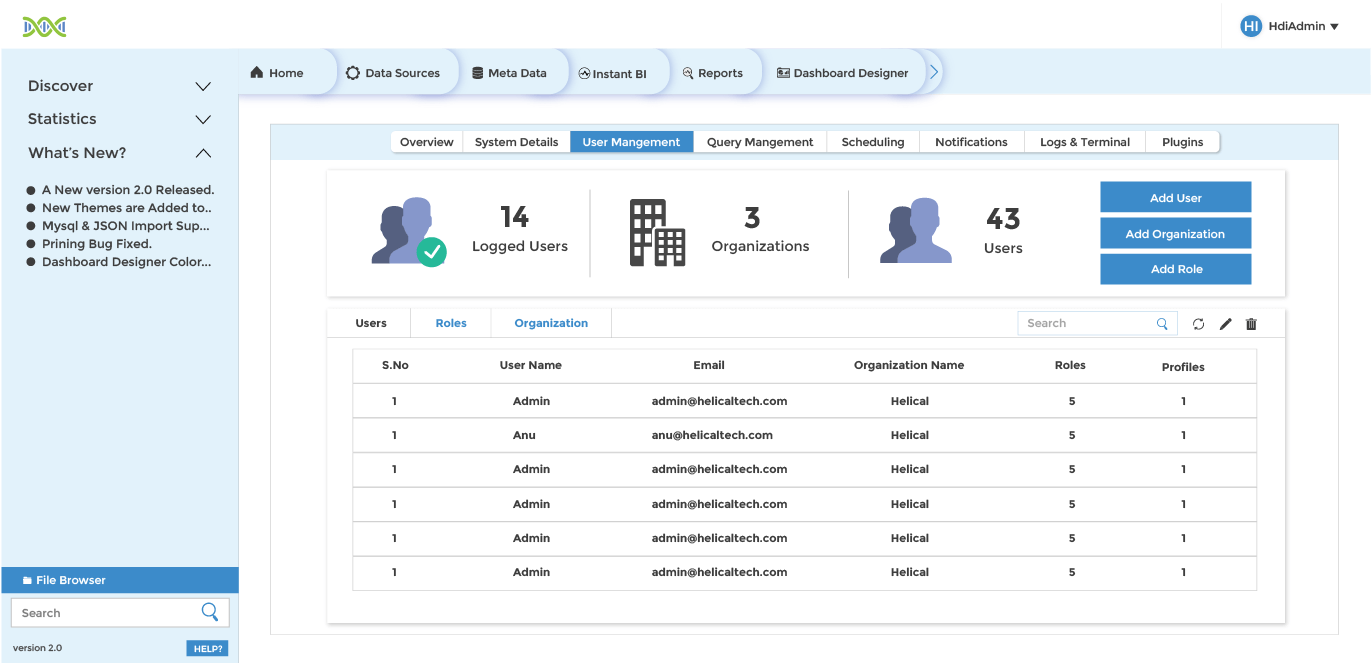
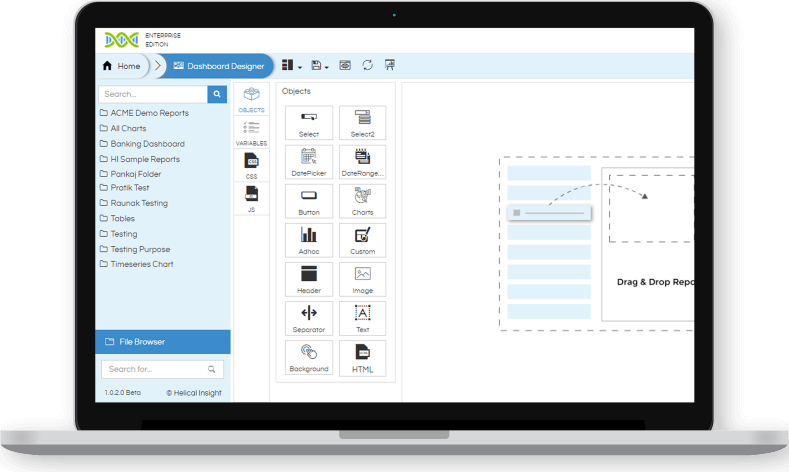
Dashboard
Dashboard Component: With various prebuilt dashboard components like header, text box, footer, image, separator, shadow etc it’s very easy to create a dashboard the way you want from the UI itself. Also with little HTML knowledge you can also add your own dashboard components as well as further add HTML, CSS, JavaScript for more customizations.
Drill down / drill through / Interpanel communication: Now, from the UI itself, it is possible to implement drill down, drill through and inter-panel communications.
Datasource
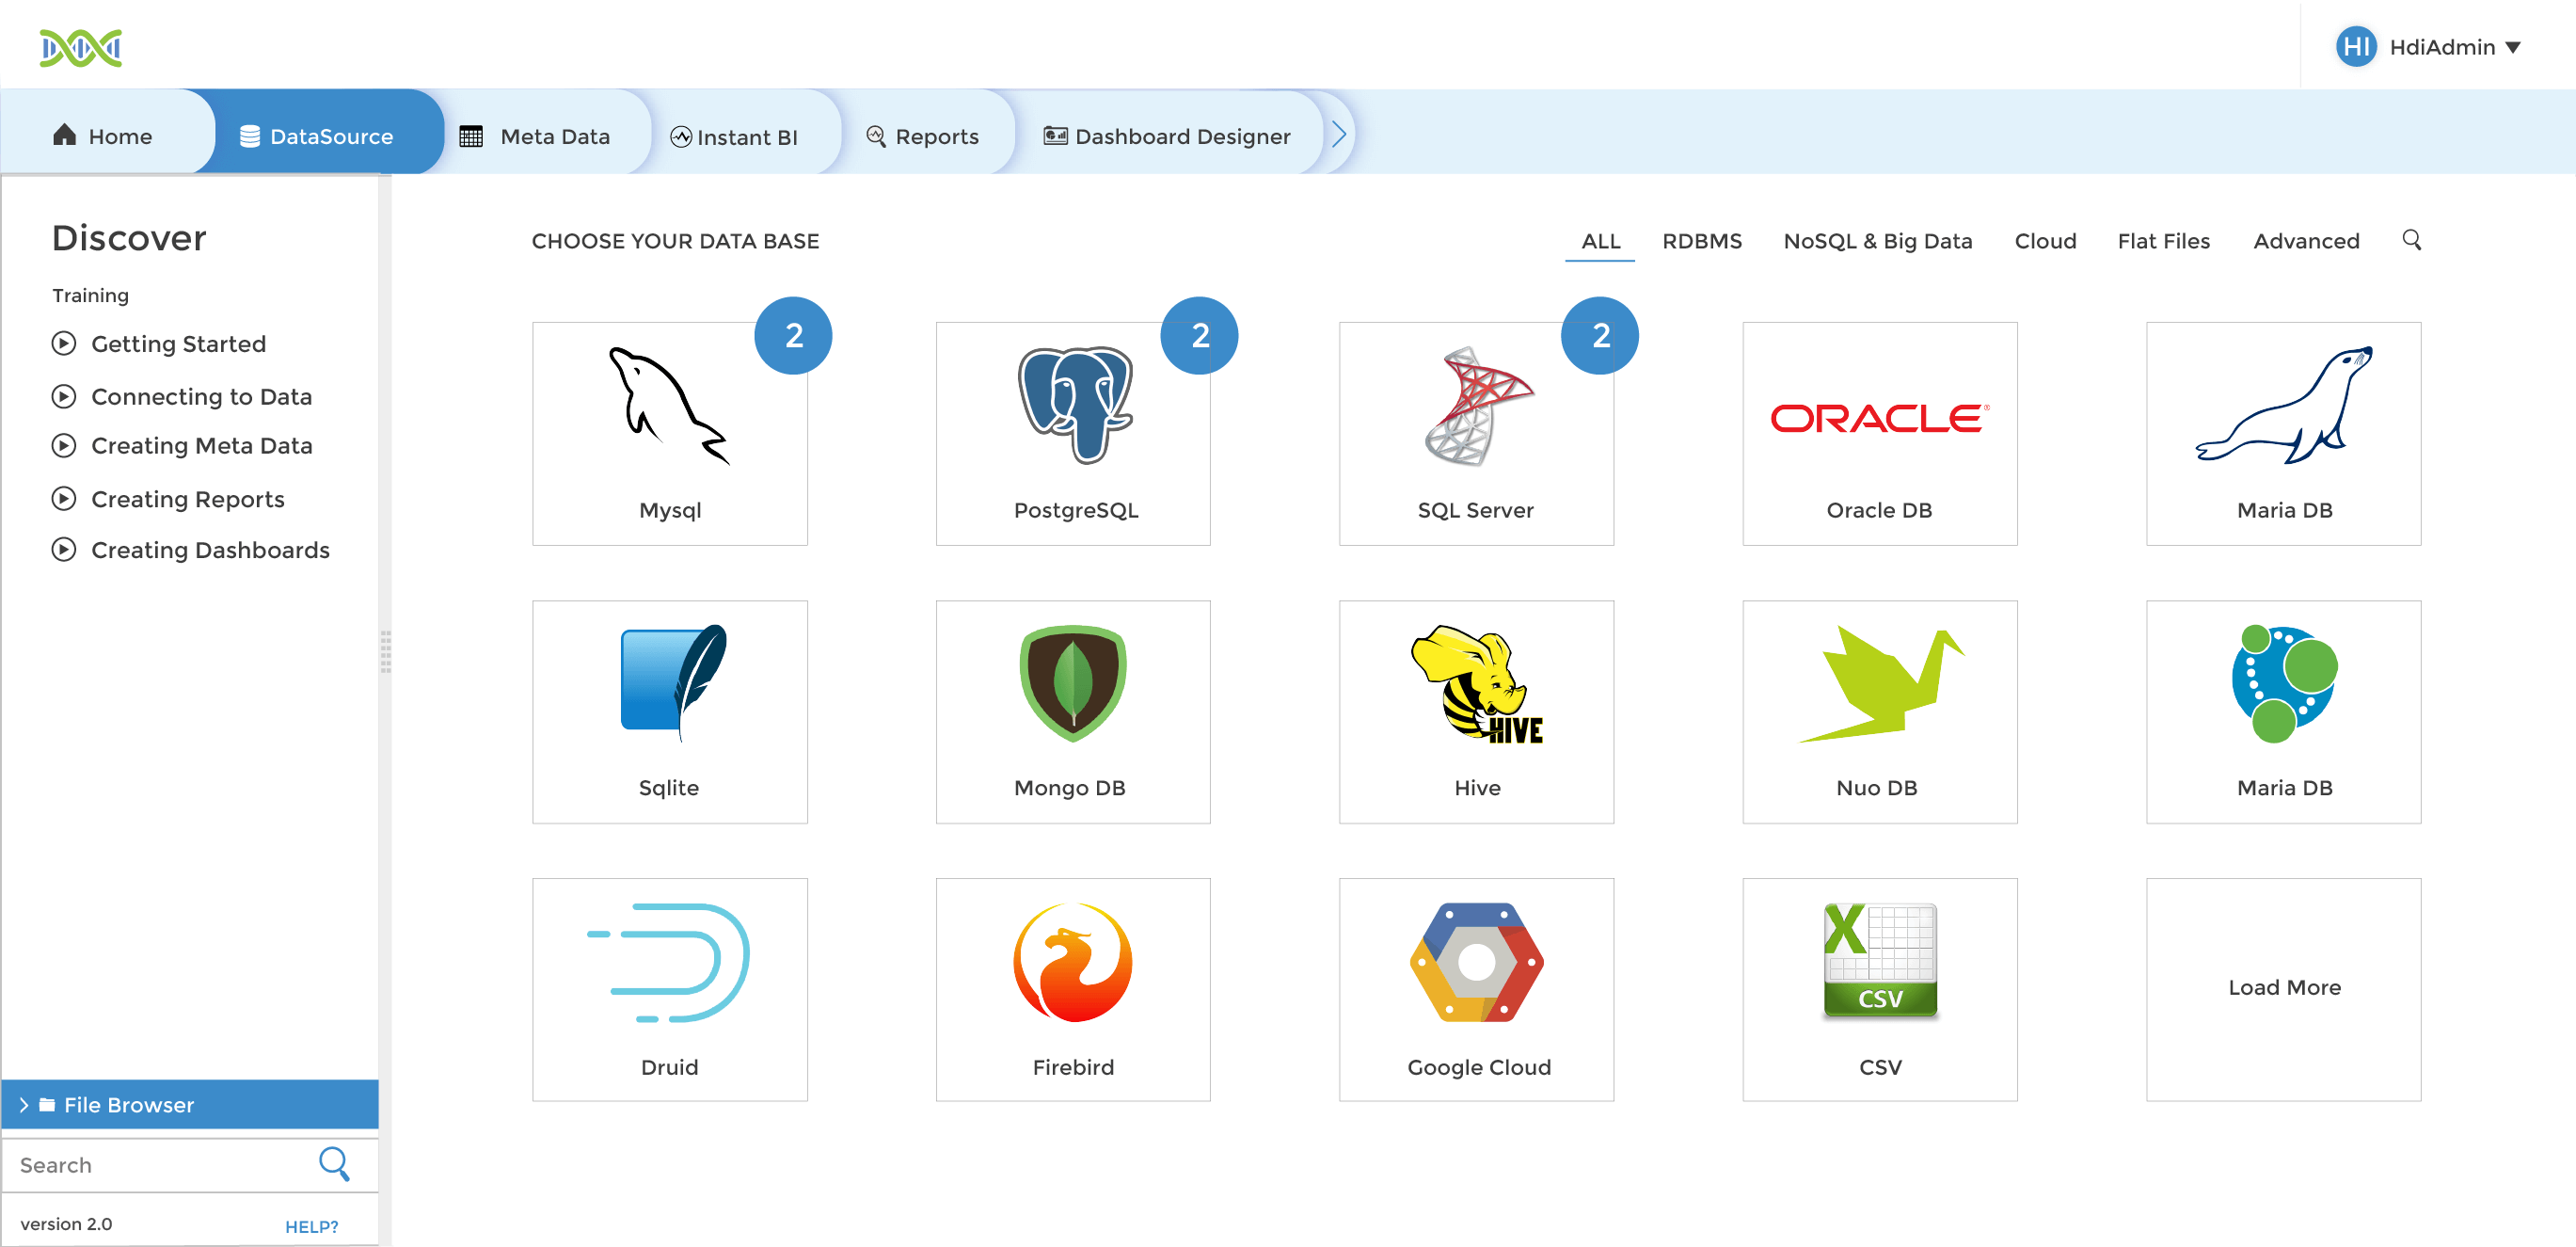
Dynamic Datasource
With Helical Insight 2.0 you will have the option of connecting the same metadata to different datasources based on the user / role / organization. Hence the same report can be accessed by different users and based on the defined rule it can fetch data from different datasources.
More Connection Options
Helical Insight now will provide many more connection options from UI which includes Mongo, CSV, Excel, Cassandra and many more. You can also extend and add more connection options at your end using your developers.
Other Features

Exporting Options
Now user will have various options while exporting into PDF like A2/A3/A4, portrait/landscape, header/footer and many more. User can save these settings as template. Hence a user can export and print the way he wants.

Keyboard shortcuts
Open any page like Adhoc report page, dashboard page, datasource page, metadata page or any other functionality quickly by using the keyboard shortcuts.

Tour
With a tour option button at the top help is only a click away. Click on it to get an overview of your current page.

Preview
With preview option, visualize how your current report and dashboard will appear to an end user. Presentation mode allows you to view the report or dashboard in full-screen.
