Helical Insight 2.1 IS HERE
We are thrilled to announce the launch of Helical Insight 2.1 which is much more powerful now and has many new exciting features. We take our customer’s feedback seriously and work upon it thoroughly with only one goal in mind that is, customer satisfaction. With New visualization options, new chart customizations, performance enhancement, advanced filtering capabilities, one-click sharing and many more new features, the new version will make self service BI and Data Analysis much more easier. Read further to know more.
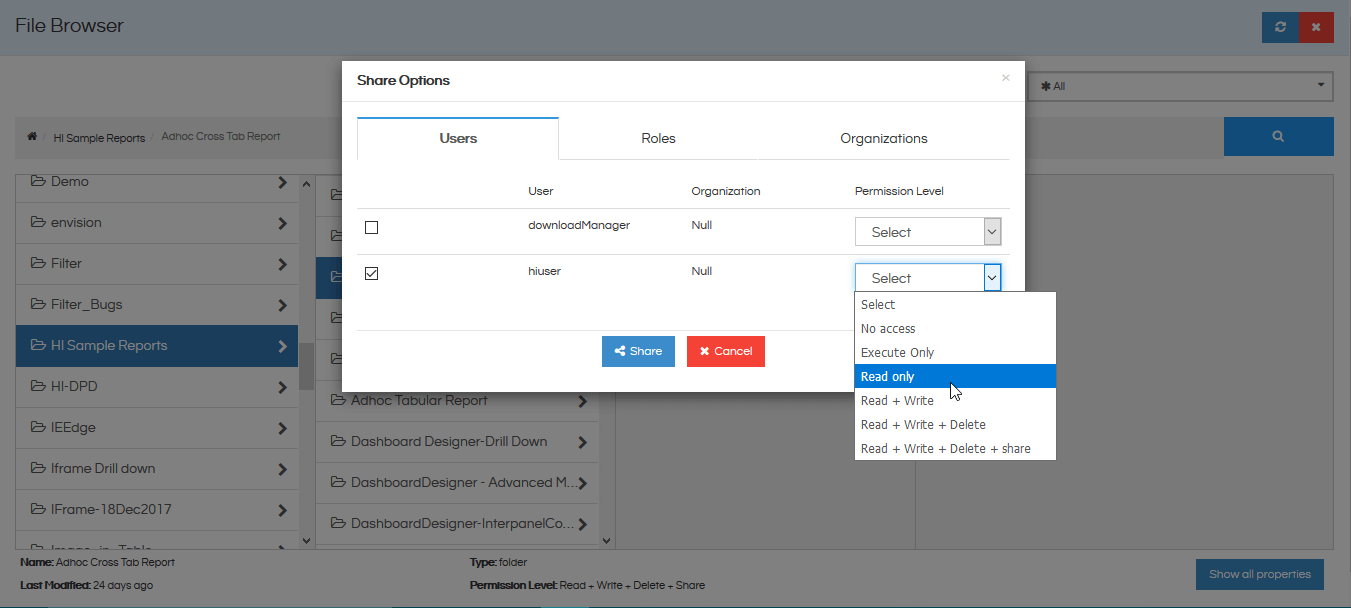
Sharing Feature

Bundled sharing
Now sharing is much easier. User can now share any report/dashboard simply by a single click. Users can now share all the folder content, which includes reports dashboards, other folders and files, without sharing them individually.

Permission level
Apart from bundled sharing, the author of the report/dashboard can now set a permission level (like read, read write, read write delete etc.) while sharing the report/dashboard. Any of the 6 permission levels can be selected while sharing.
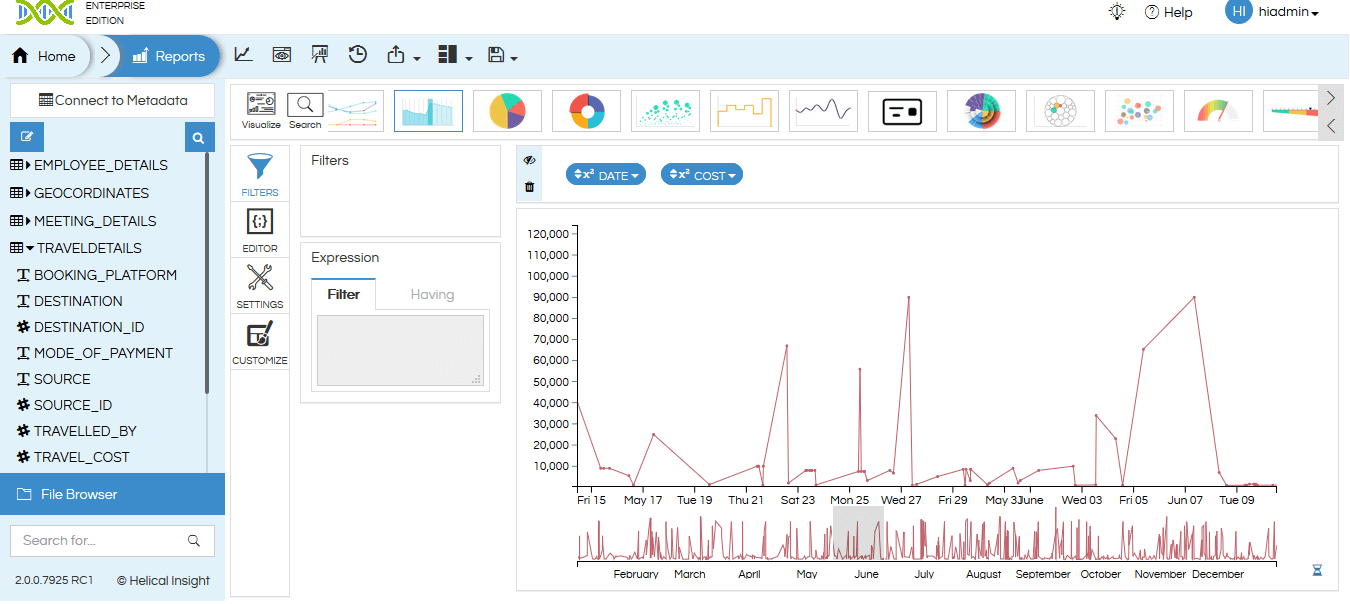
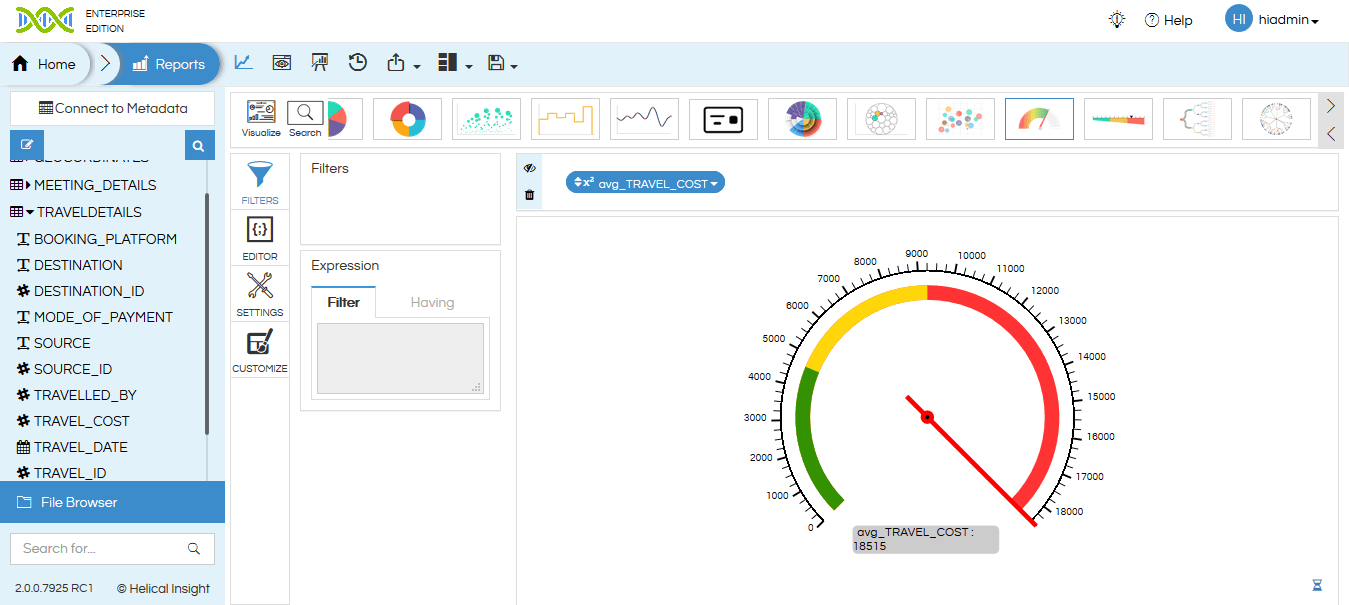
Adhoc Reports

New Visualizations
New visualizations like Time series, polar, radar, linear gauge, circular gauge & card widget are available on UI now.

Chart Customizations
15 new chart customization options available on UI. These include Axis range color and rotation customization, data labels, static gridlines, value-based colouring, adding additional Y axis, axis tick rotation, axis range etc.

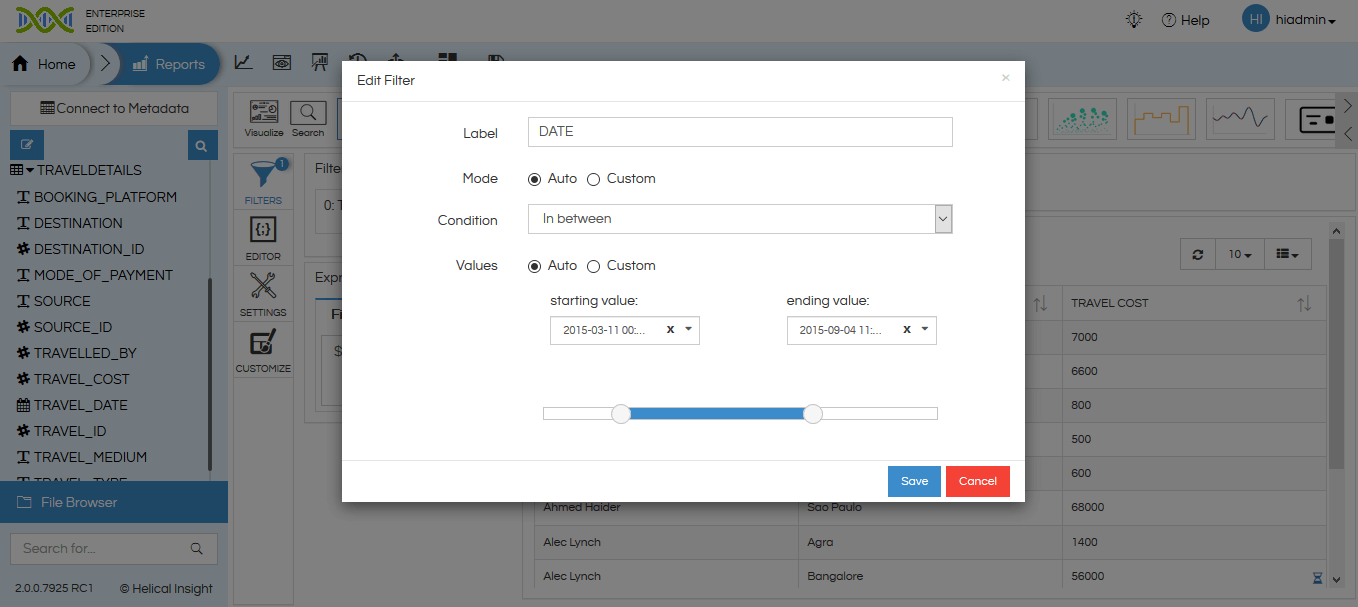
Advanced filters
Advanced filtering capabilities based on data types used at filter (greater than, less than, greater than or equal to, less than or equal to, starts with, does not start with, ends with, does not ends with, contains, does not contains, date range etc.)
Custom Cache refresh
Users can now set data refresh rate separately for each individual chart.
New DB connectivity
Additional out of the box database support, thus connect and analyse from more data sources.
Other Features
Alternate method of Report embedding in
Dashboard Desginer
Users can now embed reports inside dashboard using either iFrame or Javascript (dashboard.js) method based on their requirement. Javascript method results in much faster rendering.

Bug fixes, security & performance improvements
All the known issues and bugs from Helical Insight 2.0 have been fixed and the performance increased and UX has been further revamped.