Helical Insight offers out-of-the-box customization scripts. Some customizations such as report background, header, footer, heading, tooltip etc. are common for all chart types. However, there are other unique chart customization scripts based on the type of chart that has been chosen. Detailed steps to customize Dendogram charts are given in this blog.
Create a Report with Dendogram as the chart type. Click on the Customization tab.
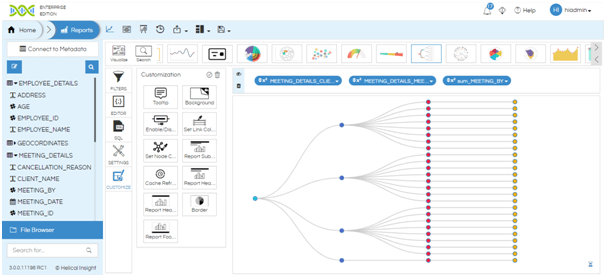
Apart from standard customizations, there are 3 types of customization for dendrogram:
- Enable/Disable Data Labels
- Set Line Colour
- Set Node Colour
Step 1: Double Click on “Enable/Disable Data Labels” button.
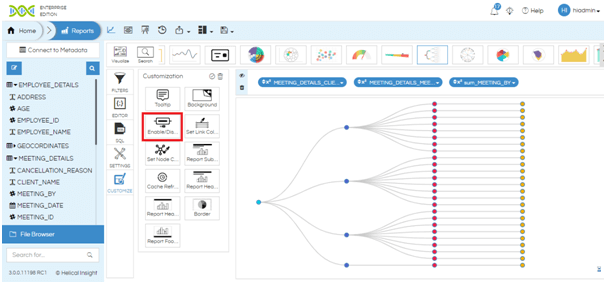
Step 2: Toggle the button.


Step 3: Click OK. Note that the Enable/Disable Data Labels button is highlighted now.
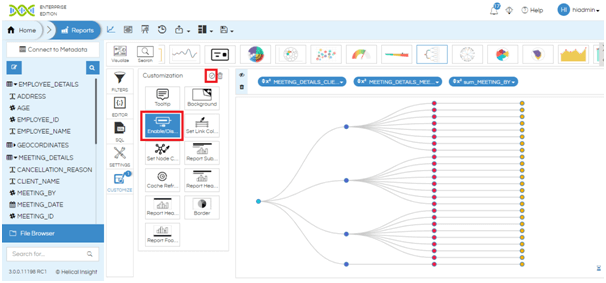
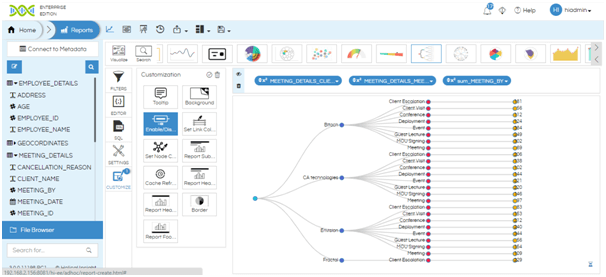
Step 4: Click on the tick button on the top right corner of the Customization tab. The customization is applied.
Step 1: Double Click on “Set Link Colour” button.
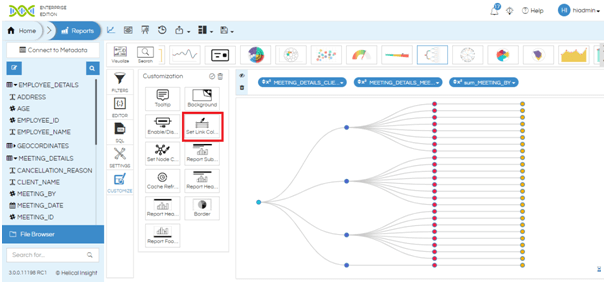
Step 2: Click on Add.

Step 3: Select the Start and End-point of the line that you want to change the color of by choosing the dimensions and their values. Set the width and color of the line. You can add more conditions by clicking on Add. Click OK.
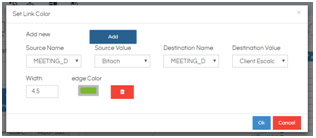
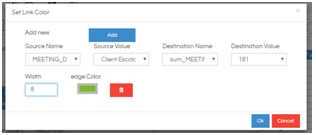
Step 4: You will see that the “Set Line Colour” button is highlighted.
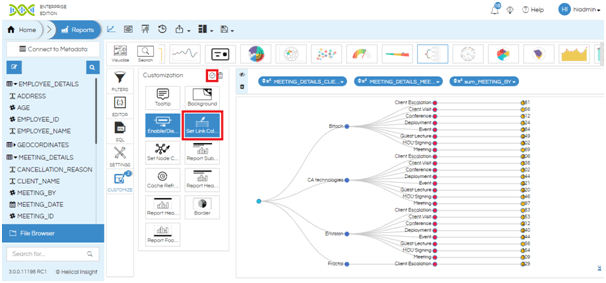
Step 5: Click on the button on the top right corner of the Customization tab.
The customization is applied.
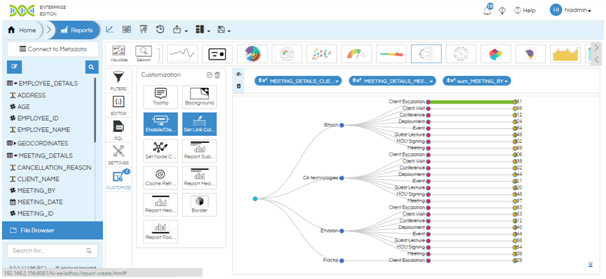
Step 1: Double Click on “Set Node Colour” button.
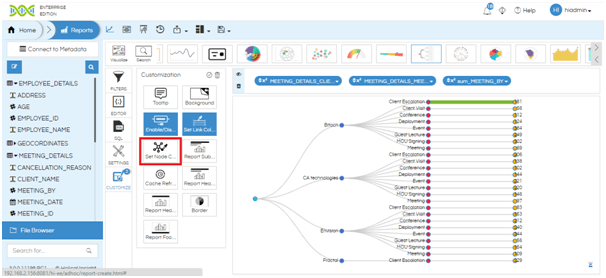
Step 2: Click on Add.

Step 3: Select the node(s) that you want to change the color of by selecting the dimension and values. Set the size and color of the node. You can add more conditions by clicking on Add. Click OK.

Step 4: You will see that the “Set Node Colour” button is highlighted. Click on the button on the top right corner of the Customization tab.
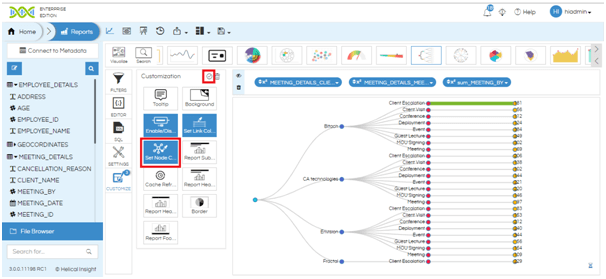
The customization is applied.
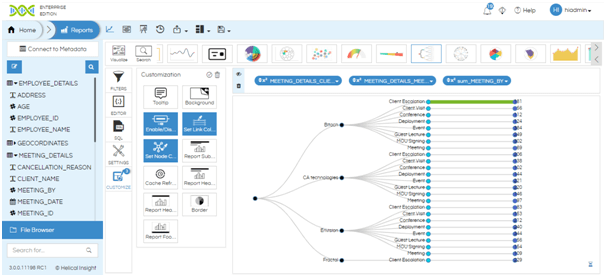
Please Note: Since all the above 3 customization buttons are highlighted, all the 3 customizations are applied simultaneously.
For more information you can email on support@helicalinsight.com
