In this blog, we will cover the page properties like page size, background etc. The report page properties options appears when we have clicked on the report (and not on any component like text line etc) and then on the right side we can see various kind of properties options. We will be explaining those properties options here.
PROPERTY PANE
The property pane is used to set the properties of the selected component.
When you click on empty canvas or empty section of the canvas, the properties for the entire report can be set.
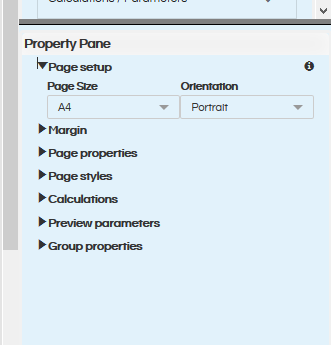
- Page Setup: You can select the page size and orientation in this section of the report that you would like to create. Based on the kind of report that you would like to create there are various kind of options like A0, A1, A2, A3, A4, A5, A6, A7, A8, A9, A10, B0, B1, B2, B3, B4, B5, Legal and Letter.
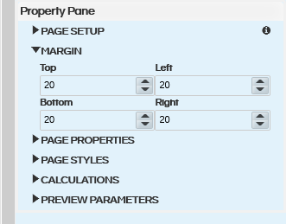
- Margin: You can set the Top, Left, Bottom and Right margins for the page. The margins specified here are in pixels.
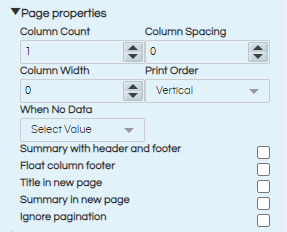
- Page Properties: In this section you can set the default properties to be used on a page.
- Column Count: This is the number of columns into which the entire report should be divided into. For example in a single report you want to print fees, one is management copy and the second is end user copy. Then in column count we will specify 2 and in each column a report will be created.
- Column Spacing: Defines the spacing between two adjacent columns if the report is divided into more than 1 columns.
- Column Width: This is defined when the report is divided into more than 1 columns. The width of column can be defined.
- Print Order: When there are multiple columns, whether the data should be printed row-wise or column wise that can be specified here. Print order can be horizontal or vertical.
- When No Data: Defines what to display when there is no data available for the selected fields.
- All Section No Details – This will show all the sections but there will be no data that will be printed. So, the template will still be visible.
- Blank Page – A blank page will appear when there is no data.
- No Data Section – A section will be printed on the page which will have a custom script. This script can be set by right clicking on the text box which you want to display when there is no data and selecting Repeat option as No Data.
- No Pages – If this is selected, then you will not see any page at all when there is no data.
- Summary with header and footer: Select if the summary must be available in a separate last page along with header and footer. By default summary is without header and footer. (confirm)
- Float column footer: Select if the footer should appear at the bottom of where the data gets over instead of at the very bottom of the page. (confirm)
- Title in New Page: The title of the report will be printed on a new separate initial page. The topmost component will be taken as the title. (confirm, also how can we create a title)
- Summary in new page: Select if only summary should appear on the last page separately. The bottom most component will be taken as summary. (confirm)
- Ignore pagination – all the data is visible on single page.
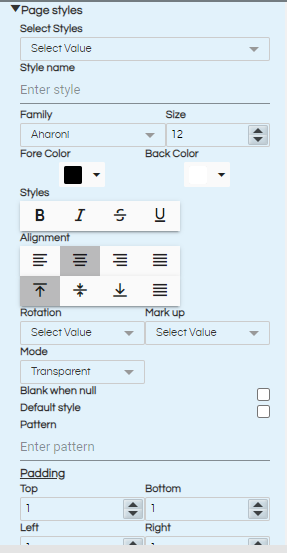
- Page Styles: You can define a set of styles to be used throughout the report. You can save this style and select it after selecting the components that will be using this style. In this section you can set the following properties like
- Font style and size
- Fore color and background color
- Alignment – Various kind of alignment like left align, centre align, right align, centre align, top align, bottom align, centre align.
- Rotation – this defines the orientation of the text in the cell. Left means it will rotate anticlockwise by 90 degree, right means it will rotate clockwise by 90 degree, upside down will rotate the text by 180 degree.
- Padding – defines the space between the border of the component and actual text or data
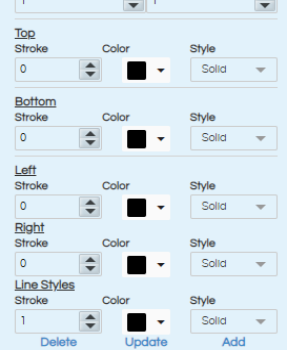
- Border -you can define the thickness of the border stroke, color and style of the border
- line styles – defines the style to be used for line component.
- Markup – You can set the markup format that should be used to embed the style component in the text component.
- Mode – When set to transparent, background color will not be visible. Set to opaque to view the background color.
- There is a check box which can be selected to display a blank in case any value is Null.
- If you want to set any style as default, then you can select the Default Style checkbox.
- In the pattern section, you can give the desired format of the text/data to be displayed.
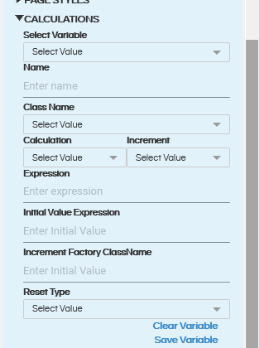
- Calculations: In this section, you can define the custom calculations. Things like running sum or group sum, percentages, ration etc and other custom calculations can be defined here. You can go through this blog to learn in detail of how to apply calculations.
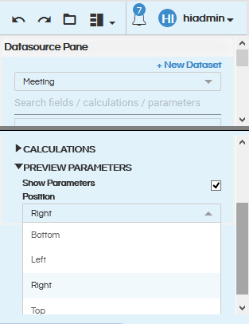
- Preview Parameters: Select whether or not to show the parameters on the frontend while a person is viewing the report in read mode. Even if “Show Parameters” is not selected even then the values of the filters can be passed from the URL. This is more specifically useful when we are looking into embedding and passing the values from the URL itself and not giving the end users the option to actually change the input parameter values.
- Group Properties: You can set the properties for any particular group using this section. The following options are available:
- Select Group – Select the group that you are setting the property for.
- Minimum height to start new page – Minimum height after which the data should appear on a new page.
- Minimum records to start from top – Define the number of records to be rendered on the current column, so as to avoid starting the group on a new column
- Reprint header on each page – checkbox, if selected, on every page, the header of the group will be visible.
- Keep together – select to keep all the records of a group together
- Start new column – select to start a new group in new column
- Start new page – select to start a new group on a new page
- Reset page number – select to reset the page number after each group
- Prevent orphan footer – select to
Page orientation can be either Portrait or Landscape.
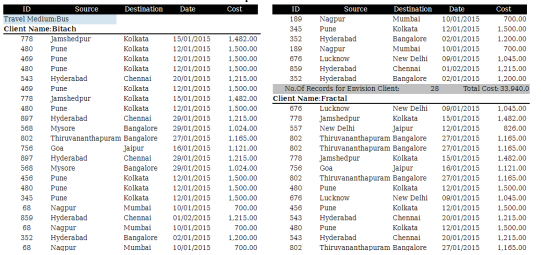
Example of Horizontal Printing- The records are printed row-wise. So the first record is in the first row first column and second record is in the first row second column
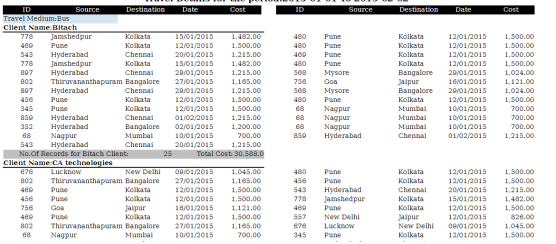
Example of Vertical Printing- The records are printed column-wise. So the second record is printed in the same column as the first record. Records are printed in the second column when the first column height is exhausted.
The various options present here are :
After defining the style, you can select any component on the canvas and in component properties, you can select the style to be used.
Aside the input parameters values position can be either Left, Right, Top, Bottom when a person is viewing the report in read mode. You can read out separate blog to learn how to add input parameters and configure it.
When a text/line component is selected, the property pane changes so that the relevant properties of individual components can be set. You can read more about these properties in the respective blogs.
For further assistance, kindly contact us on support@helicalinsight.com or post your queries at Helical Forum
