In this blog, we are going to give details of all the repeat by options that are available when we right click on any component on the canvas. The repeat by options allows to create report header, page header, page footer, report footer, report summary as well as detailed row wise data as well.
The Repeat By options indicates that you want to repeat the given component in the report. There are various options available of repeat by. The details are given below:
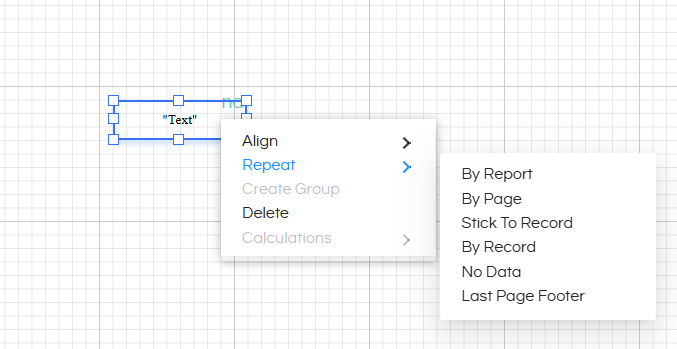
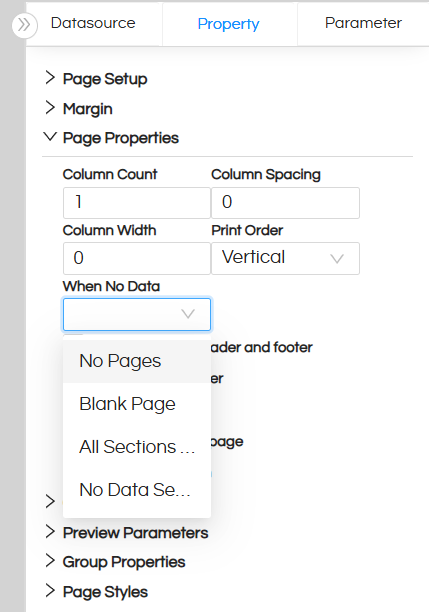
version 6.0 onwards the new UI is like shown below
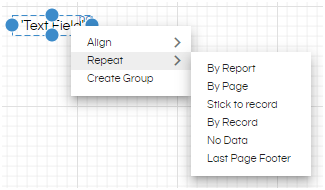
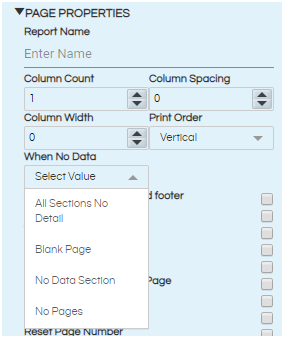
for version 4.1 or below the UI is like shown below
- By Report: Repeat by Report means that the selected component(s) will be repeated only once in the entire report. Example: – Report Header, Summary.
- By Page: Repeat by Page means that the selected component(s) will be repeated on every page of the report. Example:- Page Header, Page Number, Page Footer etc are some of the examples which are it is being used.
- By Record: Repeat by Record means that the selected component(s) will be repeated for each record and every record. This is selected by default for all fields, calculated fields and parameters that are dragged onto the canvas.
- Stick to Record: This is to be selected if the component should be used as column header or column footer. If placed above another field, it acts as header; if placed below, acts as footer.
- No Data: If main dataset is returns an empty resultset, user can show message/information in the report. Select Repeat No Record. Now select design area and in Page Properties under property pane , user has to select No Data section in When No Data property.
- Last Page Footer: The user may want the footer on the last page to be different from the footers on all other pages of the report. For example, all other pages may have page numbers only while on the last page, the footer must contain the contact details of the company. In this case, right click on the component and select last page footer. This component will be seen on the last page only in the footer section.
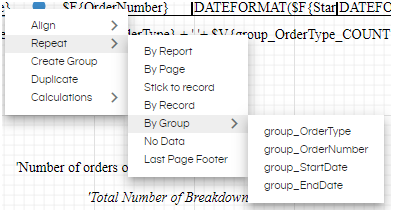
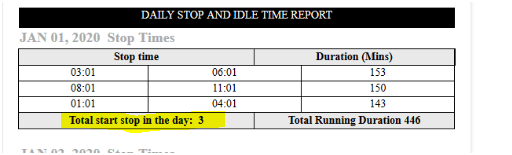
- By Group: This options appears when there is at least one group created in the report. You can select the group for which the component should be repeated. Repeat by Group is very useful when we want to show a subgroup count etc kind of things.
Hence if you have put any text at the starting of the canvas and selected Repeat by Report then it becomes report header. In a similar way if you have put any text at the ending of the canvas and selected Repeat by Report then it becomes report footer/summary.
Below is an example wherein it is added as report header, so appears only on the first page and not subsequent pages.
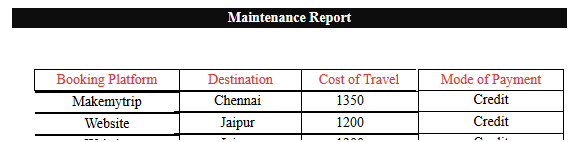
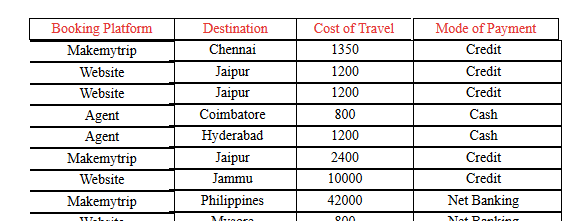
In the below image a text component is added like Booking Platform, Destination etc and perfectly aligned on top of the columns. Then it has been repeated by page so that the table header is always appearing on top of every page.
Ex: When repeat by record is used then the actual query data will be shown as example shown below.
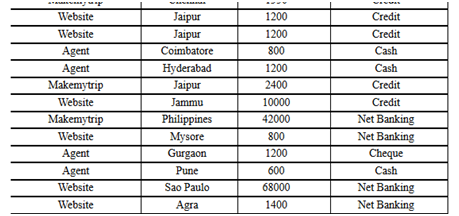
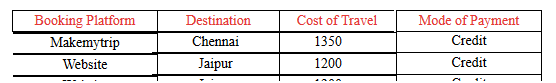
Example: As you can see in the below image the text component has been put on top of the $F component. $F component, which is coming from SQL Query, is repeat by record which allows to show the entire record. In order to show the column names we have added a text box and give it proper alias names and then specified “repeat by stick to record”. Thus on every page it is present at the top when the records start.
Note : The message/information provided in text component will be shown when main dataset returns empty result.
version 6.0 onwards the new UI is like shown below
for versin 4.1 or below the UI is like shown below
- Repeat by report (Title) (which acts as Report Title/Cover)
- Repeat by page – Header (which acts as Page Header)
- Stick to record – column header (which can act as column header)
- Repeat by record (this will be detail section and repeats for each record)
- Stick to record – column footer
- Repeat by page – Footer (which acts as Page Footer)
- Repeat by report (Summary) (which acts as Report summary)
- Last Page Footer
Refer to our blog to learn how to use groupby.
For further assistance, kindly contact us on support@helicalinsight.com or post your queries at Helical Forum
