In this blog, we will see the usage of the quick functions or calculations available on the datasources pane of Canned reports module of Helical Insight. All the calculations when dragged onto the canvas appears with the extension $V{function_name}
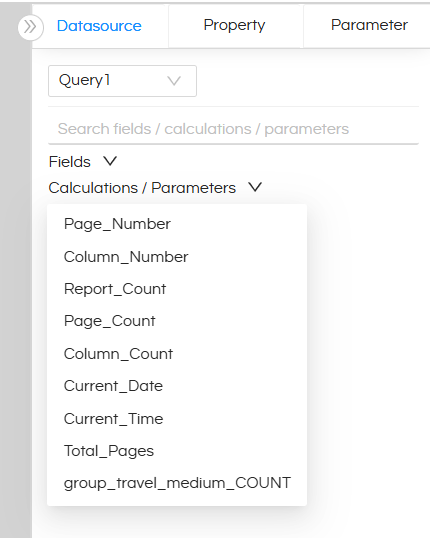
version 6.0 onwards the new UI is like shown below
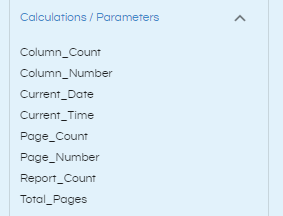
for version 4.1 or below the UI is like shown below
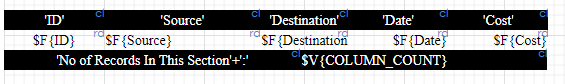
The calculations listed in the datasources pane can be used directly into the reports as variables by dragging them onto the canvas. Quick Function variables are represented by $V on the canvas.
Following quick functions are available:
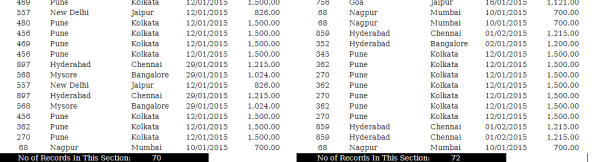
- Column_Count: This quick function will give the count of number of data rows.
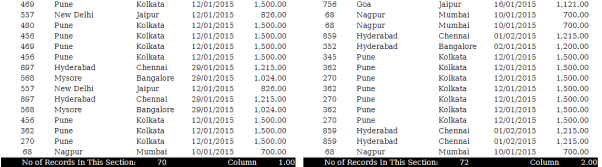
- Column_Number: Number of column. For example in below image we can see that the entire report has been divided into two columns via report page properties. The same information we can see with Column_Number as it shows what is the current column number.
- Current_Date: Displays the current server date where Helical Insight is deployed (Not the local date of the end user who is viewing/browser time).
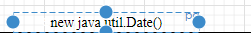
- Current_Time: Displays the current server time where Helical Insight is deployed (Not the local time of the end user who is viewing/browser time).
- Page_Count: displays the number of records on the page
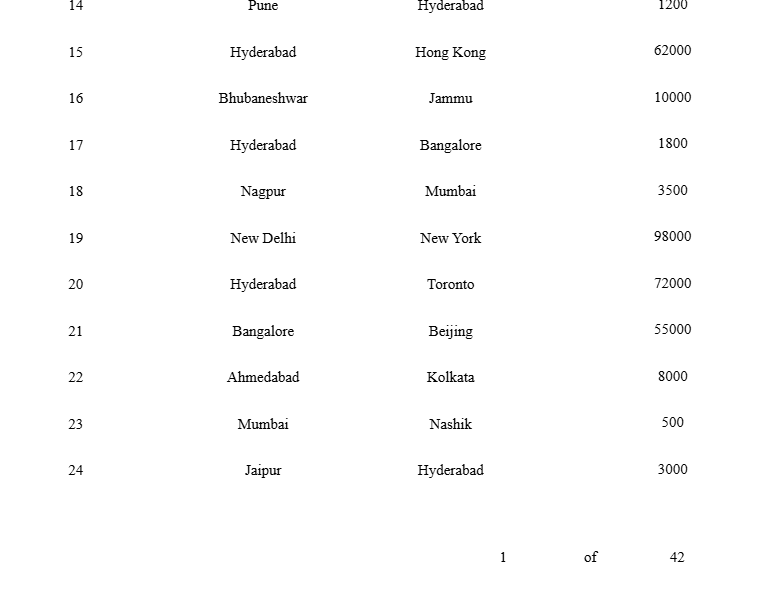
- Report_Count:This displays the TOTAL number of records in the report
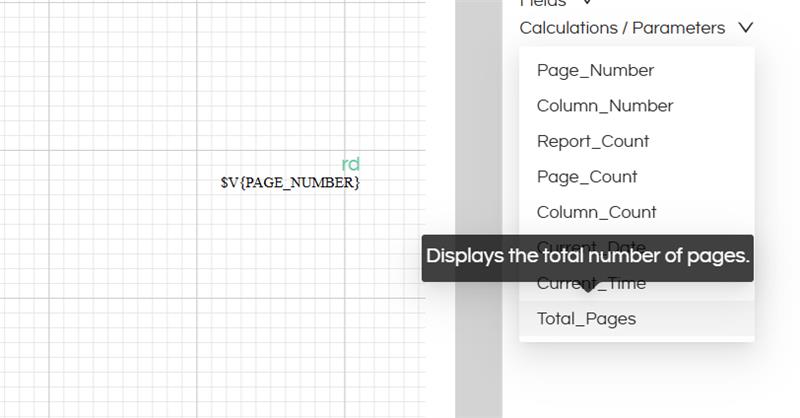
- Page_Number: displays the page number of the current page. If your report is running across multiple pages then Page_Number can be used to show the current page number. $V{PAGE_NUMBER}
- Total_Pages: Displays the total number of pages in the report. In order to use this, we should drag “Total Pages” variable onto the canvas. Use appropriate repeat by options in order to show it once or on every page etc.
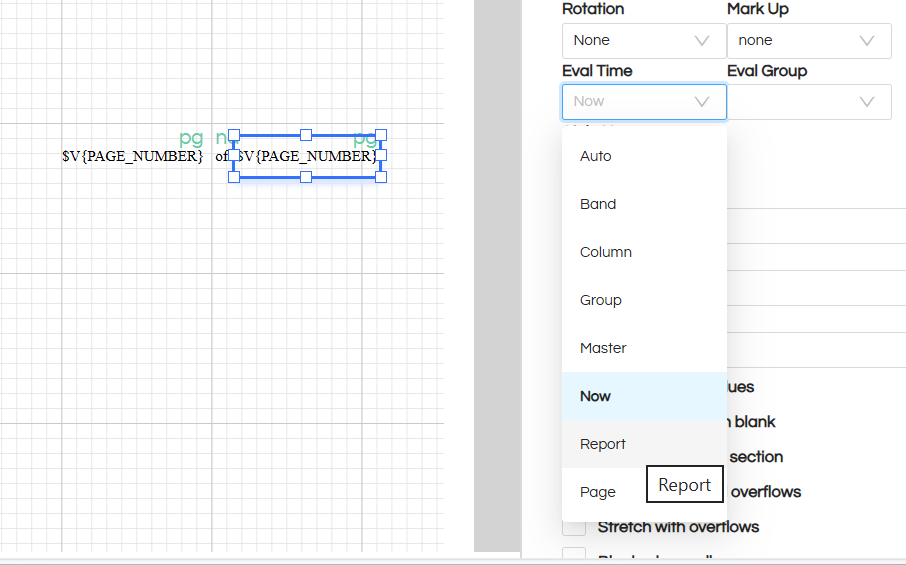
In order to show total pages, we should mention “Eval Time” property for the Total Pages variable which we have dragged onto the canvas just now. When we click on that variable, in the text field of Property pane we can see these properties (refer below image). By default “Eval Time” field property for the “Total Pages” variable is “Now”. We will have to change it to “Report”.
When we preview the report, it appears as shown below.
The output looks like this:

And the output is shown as below
Canvas:

Output:

Canvas:
Output:
Canvas:

Output:

Canvas:

Output:

For further assistance, kindly contact us on support@helicalinsight.com or post your queries at Helical Forum
