Implementing Data Security In Canned Reports Based On Logged In User’s Profile Name and Profile Values

Introduction: In this blog we are going to explain how to implement data security based on the user’s profile attributes. We have created sample tabular report having the data of client wise meeting date. A user can have multiple profiles associated with him and each profile can have one or multiple profile values assigned to him.

In this example, we want to filter the data based on the profile value of the user who is logging in. Please make sure you have gone through the blog  “Introduction to Canned Reports Interface ”.

Steps to implement Data Security

  1. Change the setting.xml file:
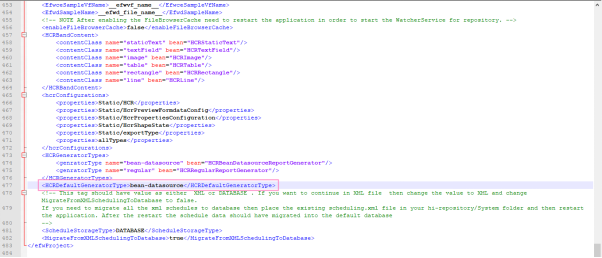
  2. Open the setting.xml file present in location /hi/hi-repository/System/Admin/ folder.
    Search for <HCRDefaultGeneratorType> tag. By default, this is set to “regular”. Change this setting to bean-datasource. Save the setting.xml file. Once done restart the server.

  3. Create a Datasource Connection :
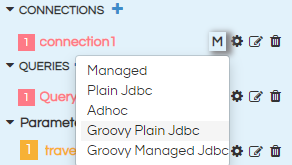
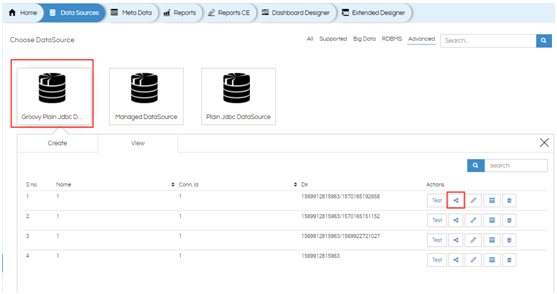
  4. On the datasources page, create a datasource connection with type Groovy Plan Jdbc. Please note that if you want to apply data security you have to use Groovy Plain JDBC only.

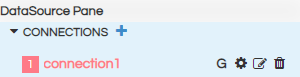
    If you click on configure icon, the data source configuration place holder will be opened

    Provide the details in the configuration details as shown below :

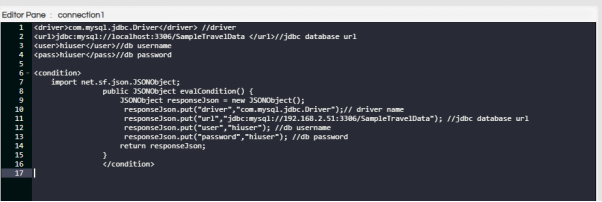
    Make sure that save the configuration code by clicking on “Apply” or (Ctrl+s)

    Configuration code :

    <driver>com.mysql.jdbc.Driver</driver> //driver
    <url>jdbc:mysql://localhost:3306/SampleTravelData </url>//jdbc database url
    <user>hiuser</user>//db username
    <pass>hiuser</pass>//db password
    
    <condition>
        import net.sf.json.JSONObject;
    				public JSONObject evalCondition() {
    					JSONObject responseJson = new JSONObject();
    					 responseJson.put("driver","com.mysql.jdbc.Driver");// driver name
    					 responseJson.put("url","jdbc:mysql://192.168.2.51:3306/SampleTravelData"); //jdbc database url
    					 responseJson.put("user","hiuser"); //db username
    					 responseJson.put("password","hiuser"); //db password
    					return responseJson;
    				}
    				</condition>
    

    Note : In the above configuration we are providing mySQL database details, make sure that the mySQL driver has been uploaded from the frontend ( or the relevant driver is present in the drivers folder at the backend.)

    Refer to this link to understand How to Add a New Driver.

  5. Query:

In the SQL section, we write the query that will be executed to generate the report data. Here, we shall specify a where clause in order to filter out the data based on the user name that we get from the Sessions variable. The session details are stored in GroovyUsersSession object.

import com.helicalinsight.efw.utility.GroovyUsersSession;
public String evalCondition() {

String responseJson;

String selectClause = "select travel_type,travel_medium,source,travel_cost from travel_details ";

String profileValues = GroovyUsersSession.getValue('${profile[\'source\']}');
if(profileValues==""){
whereClause ="";
}
else{
whereClause = "where source in (${profileValues}) "
}
responseJson = selectClause+ "" +whereClause;

return responseJson;
}

Note : We can give filter conditions based on our requirement in the query. Click on apply to save the query and run to see the output.

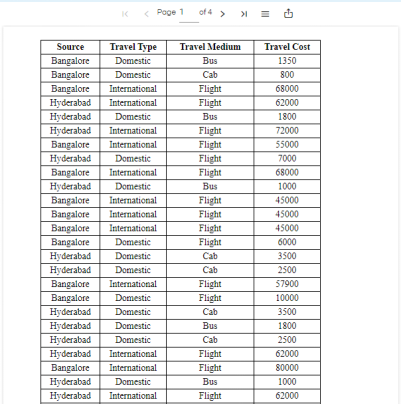
Report view test case 1 :

Report view when we logged in with profile: source : Hyderabad,Bangalore . Username : hiadmin

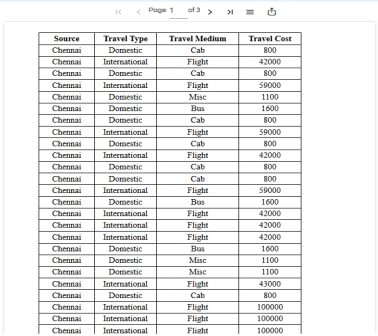
Report view test case 2 :

Report view when we logged in with profile – source : Chennai, username : hiuser

Note: Refresh the cache of the report in order to avoid cache data

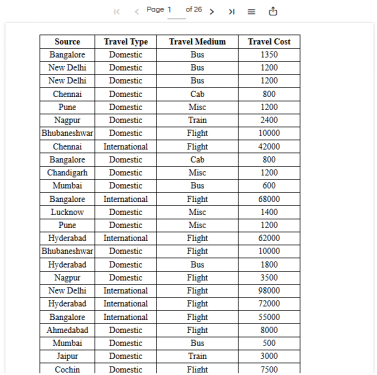
Report view test case 3 :

Report view when we logged in with no profiles , testuser – no filter condition

Note: Refresh the cache of the report in order to avoid cache data

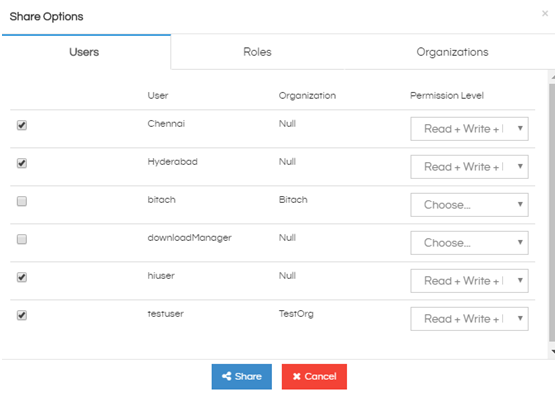
Note : In order to view data when logged in as a user other than hiadmin, first share the report with that user or role or organization.

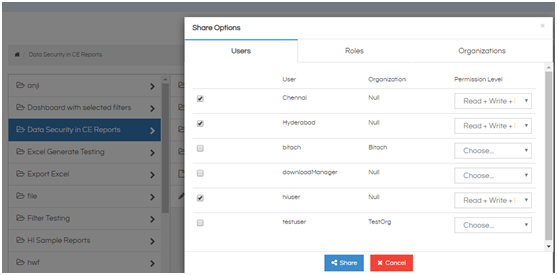
Also share the Groovy Data source with proper permissions. To view the Groovy datasource, go to “Advanced” section of the Datasources Page. Its always advisable to share the datasource in execute mode only with other users. Go through our blogs on sharing datasource as well as reports dashboards to learn more.

For further assistance, kindly contact us onsupport@helicalinsight.com or post your queries at Helical Forum

Helical Insight’s self-service capabilities is one to reckon with. It allows you to simply drag and drop columns, add filters, apply aggregate functions if required, and create reports and dashboards on the fly. For advanced users, the self-service component has ability to add javascript, HTML, HTML5, CSS, CSS3 and AJAX. These customizations allow you to create dynamic reports and dashboards. You can also add new charts inside the self-service component, add new kind of aggregate functions and customize it using our APIs.
Helical Insight, via simple browser based interface of Canned Reporting module, also allows to create pixel perfect printer friendly document kind of reports also like Invoice, P&L Statement, Balance sheet etc.
If you have a product, built on any platform like Dot Net or Java or PHP or Ruby, you can easily embed Helical Insight within it using iFrames or webservices, for quick value add through instant visualization of data.
Being a 100% browser-based BI tool, you can connect with your database and analyse across any location and device. There is no need to download or install heavy memory-consuming developer tools – All you need is a Browser application! We are battle-tested on most of the commonly used browsers.
We have organization level security where the Superadmin can create, delete and modify roles. Dashboards and reports can be added to that organization. This ensures multitenancy.
A first-of-its-kind Open-Source BI framework, Helical Insight is completely API-driven. This allows you to add functionalities, including but not limited to adding a new exporting type, new datasource type, core functionality expansion, new charting in adhoc etc., at any place whenever you wish, using your own in-house developers.
It handles huge volumes of data effectively. Caching, Pagination, Load-Balancing and In-Memory not only provides you with amazing experience, but also and does not burden the database server more than required. Further effective use of computing power gives best performance and complex calculations even on the big data even with smaller machines for your personal use. Filtering, Sorting, Cube Analysis, Inter Panel Communication on the dashboards all at lightning speed. Thereby, making best open-source Business Intelligence solution in the market.
With advance NLP algorithm, business users simply ask questions like, “show me sales of last quarter”, “average monthly sales of my products”. Let the application give the power to users without knowledge of query language or underlying data architecture
Our application is compatible with almost all databases, be it RDBMS, or columnar database, or even flat files like spreadsheets or csv files. You can even connect to your own custom database via JDBC connection. Further, our database connection can be switched dynamically based on logged in users or its organization or other parameters. So, all your clients can use the same reports and dashboards without worrying about any data security breech.
Our application can be installed on an in-house server where you have full control of your data and its security. Or on cloud where it is accessible to larger audience without overheads and maintenance of the servers. One solution that works for all.
Different companies have different business processes that the existing BI tools do not encompass. Helical Insight permits you to design your own workflows and specify what functional module of BI gets triggered