In this blog we are going to learn how to implement inter panel communication on charts i.e. clicking on one chart the other panels of the dashboard should get updated. In case if you want to implement inter panel communication on table you should refer to this blog

For using Inter-panel communication functionality, user needs to create two reports i.e. a parent report & a child report:-

Parent report: Primary report to which the Inter-panel communication functionality is to be applied

Child report: Secondary report which will reflect the data according to the click on the parent report columns

Note: Child report should have a filter which would be the input parameter to be passed in parent report. It is always better to create the Child report first.

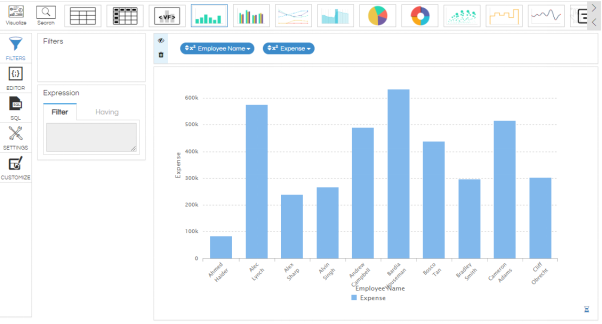
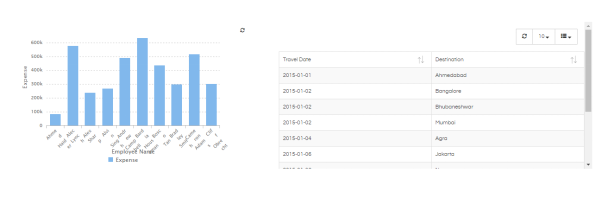
Example: Let us create a bar chart report of Employees and their expenses. We will then apply Inter-panel communication functionality on the Employee name; so if any of the employee names is clicked, a report showing Travel date and Destination will refresh and show data for that particular selected Employee name.

So in this case, parent report is the one which shows Employee name & Expenses. And Child report is the one which shows Destination & Travel date.

We will first see how to create the child report. Following are the steps to create child report:

Step 1: Create a report with Destination & Travel date as columns

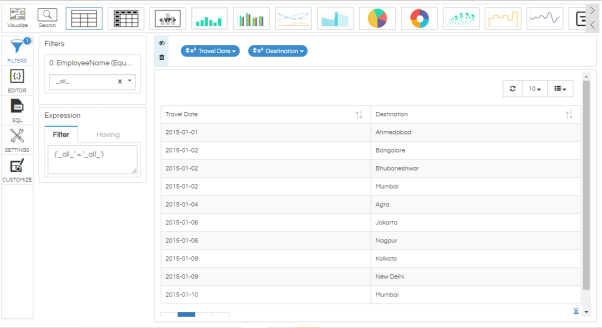
Step 2: Now add ‘Employee name’ column in the filter section and edit the filter

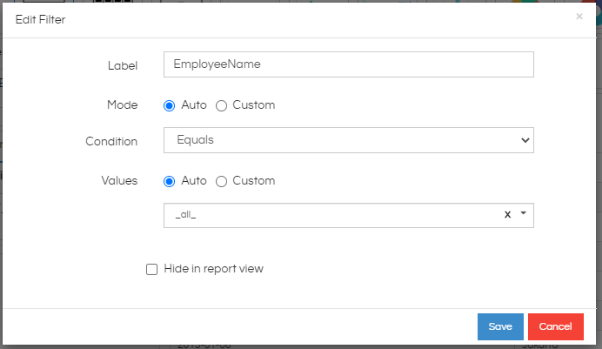
Step 3: Select mode & values as ‘auto’. Select any employee name as a default

Step 4: Click on Generate report

Step 5: Save this report in the file repository by giving an appropriate name

The child report is now ready. We can now make the parent report to which IPC functionality is to be applied. Following are the steps to create a parent report:

Step 1: Create a bar chart report with Employee name & Expense as columns

Step 2: Click on the ‘Customize’ button

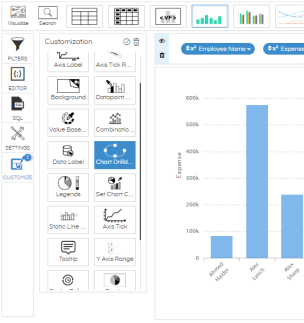
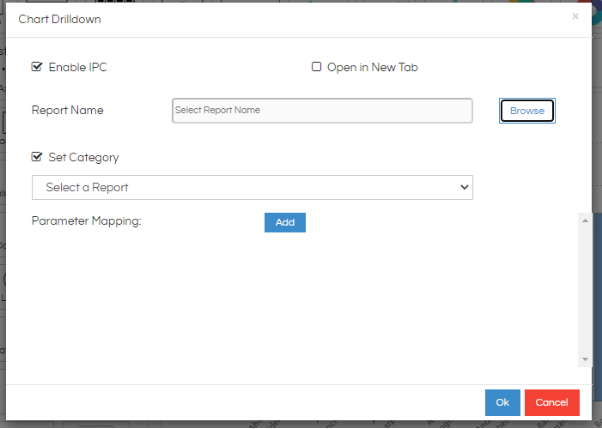
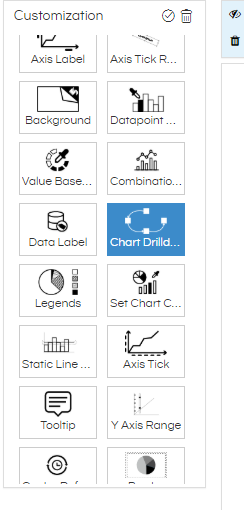
Step 3: Double-click on ‘Drill down’ icon and select Enable IPC checkbox. Click on Browse button.

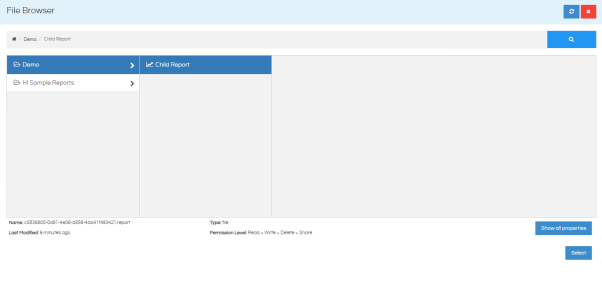
Step 4: Navigate to the child report from the file browser. Click on Select button.

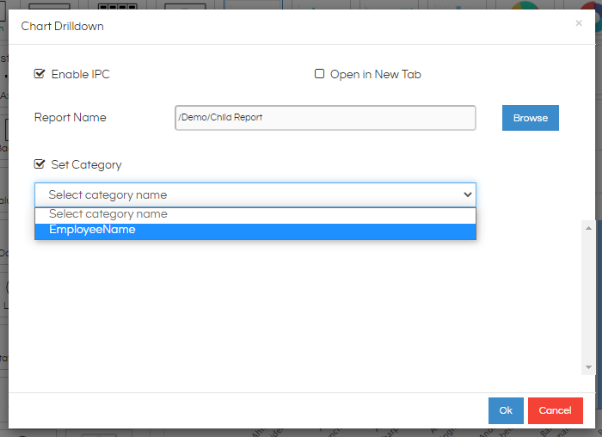
Step 5: In Set Category, select the parameter that you are going to pass (EmployeeName) from the list. Here it will show the list of all the filters which the child report is having. If there are multiple filters it will show all. Make sure you are selecting the correct Category.

Step 6: Click on OK. Click on the small tick mark at the right corner of Customisation pane to apply the customisation.

Step 7: Save the report with the appropriate name.

Step 8: Now open dashboard designer and drag the parent and child report in the dashboard canvas

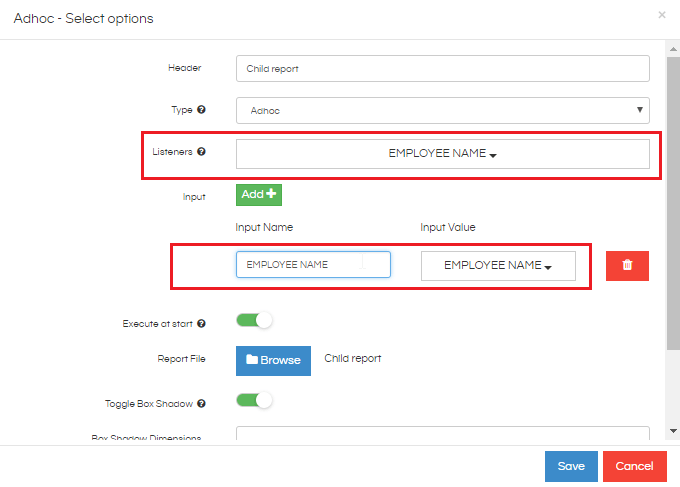
Step 9: Click on the edit icon of the child report and set the listener with the appropriate input parameter. Please note, that if the variable name is not visible, go to Variables section and refresh and save the changes. The variable will now be available.

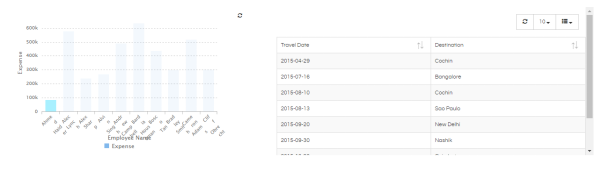
Users can now see that if any employee name is clicked from the parent report, the child report refreshes and shows data for that particular employee.

After Clicking on particular Employee Name

Your dashboard can also have multiple charts whose value should get changed when clicked on the parent report. So all those other charts also can be added to the dashboard canvas (they should also have the relevant filter i.e. in this case the other reports also should have employee_name filter) you can click on edit and apply listeners to them as well.

Thus multiple charts can be updated simultaneously by adding the relevant listener and input parameters to the charts.

For More Info, Contact us at support@helicalinsight.com

Helical Insight’s self-service capabilities is one to reckon with. It allows you to simply drag and drop columns, add filters, apply aggregate functions if required, and create reports and dashboards on the fly. For advanced users, the self-service component has ability to add javascript, HTML, HTML5, CSS, CSS3 and AJAX. These customizations allow you to create dynamic reports and dashboards. You can also add new charts inside the self-service component, add new kind of aggregate functions and customize it using our APIs.
Helical Insight, via simple browser based interface of Canned Reporting module, also allows to create pixel perfect printer friendly document kind of reports also like Invoice, P&L Statement, Balance sheet etc.
If you have a product, built on any platform like Dot Net or Java or PHP or Ruby, you can easily embed Helical Insight within it using iFrames or webservices, for quick value add through instant visualization of data.
Being a 100% browser-based BI tool, you can connect with your database and analyse across any location and device. There is no need to download or install heavy memory-consuming developer tools – All you need is a Browser application! We are battle-tested on most of the commonly used browsers.
We have organization level security where the Superadmin can create, delete and modify roles. Dashboards and reports can be added to that organization. This ensures multitenancy.
A first-of-its-kind Open-Source BI framework, Helical Insight is completely API-driven. This allows you to add functionalities, including but not limited to adding a new exporting type, new datasource type, core functionality expansion, new charting in adhoc etc., at any place whenever you wish, using your own in-house developers.
It handles huge volumes of data effectively. Caching, Pagination, Load-Balancing and In-Memory not only provides you with amazing experience, but also and does not burden the database server more than required. Further effective use of computing power gives best performance and complex calculations even on the big data even with smaller machines for your personal use. Filtering, Sorting, Cube Analysis, Inter Panel Communication on the dashboards all at lightning speed. Thereby, making best open-source Business Intelligence solution in the market.
With advance NLP algorithm, business users simply ask questions like, “show me sales of last quarter”, “average monthly sales of my products”. Let the application give the power to users without knowledge of query language or underlying data architecture
Our application is compatible with almost all databases, be it RDBMS, or columnar database, or even flat files like spreadsheets or csv files. You can even connect to your own custom database via JDBC connection. Further, our database connection can be switched dynamically based on logged in users or its organization or other parameters. So, all your clients can use the same reports and dashboards without worrying about any data security breech.
Our application can be installed on an in-house server where you have full control of your data and its security. Or on cloud where it is accessible to larger audience without overheads and maintenance of the servers. One solution that works for all.
Different companies have different business processes that the existing BI tools do not encompass. Helical Insight permits you to design your own workflows and specify what functional module of BI gets triggered