This property, as the name suggests, will be applicable for your CrossTab visualization and will allow you to enable and use options like Grant Total, Subtotal, Row total, column total etc. This is avalaible from Helical Insight version 5.0 GA onwards.
Create a crosstab report and then navigate to Properties Module.
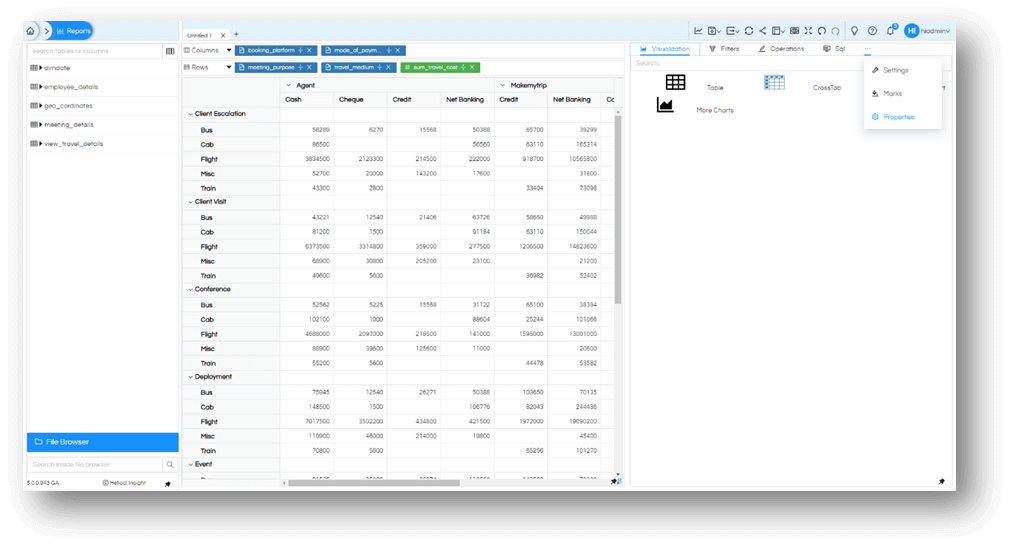
Within Properties, choose the meatball icon again and select Crosstab.
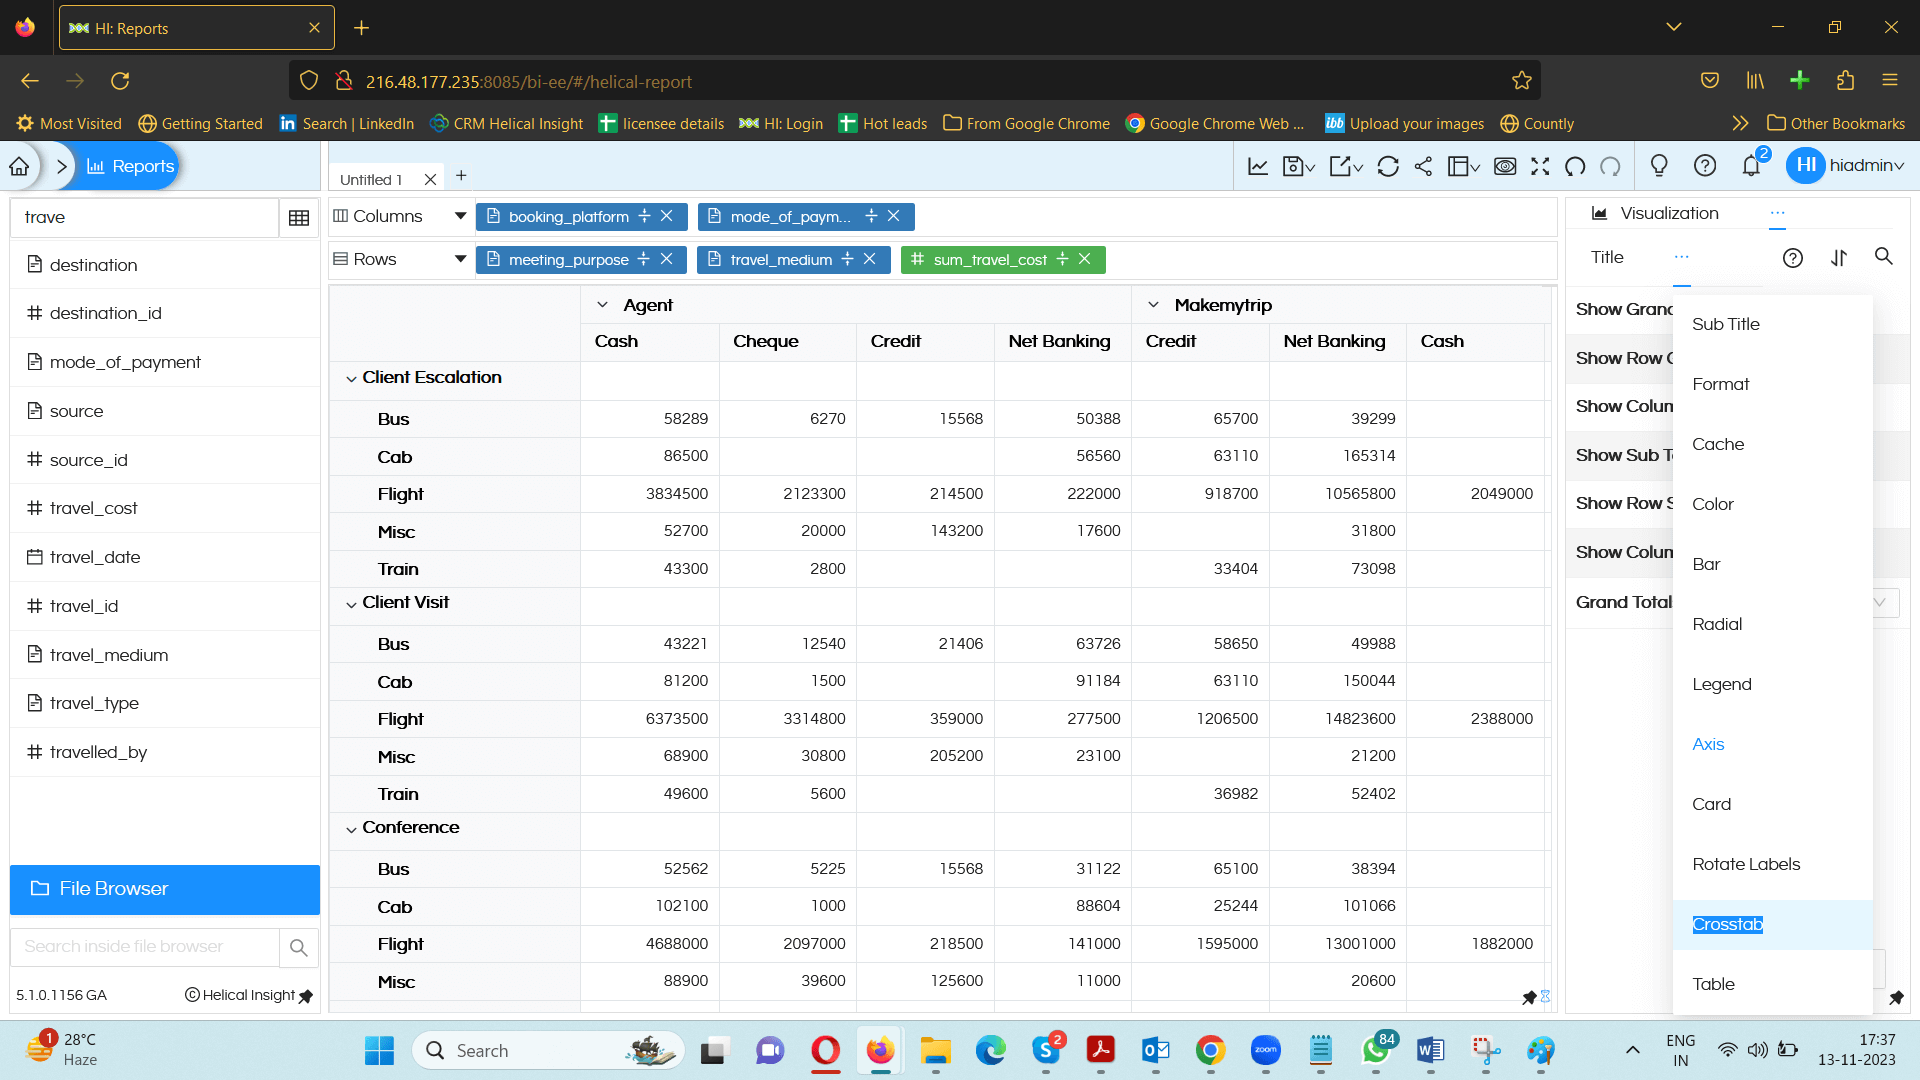
You can now choose to enable various options like Grand Total, Row Sub Total, Column Grand Total, etc for your crosstab chart. Also you can decide if you want to keep them for rows or columns, place it before all other values or at the end. Let us see all these options. The UI and explanation of these are being revamped and worked on, but you can enable them to use those functionalities.
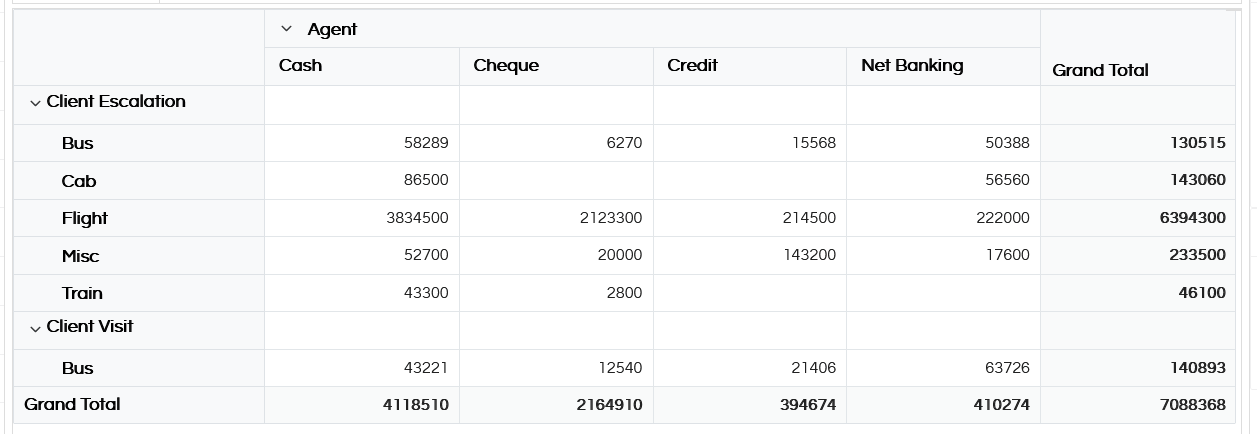
Show Grand Totals:To show the Grand totals, enable the first slider Show Grand Totals. It will add grand totals to the right side and to the bottom side also. It shows both row grand total and column grand totals. The Grand Totals position can be kept as Bottom or Top using Grand Totals Position option.
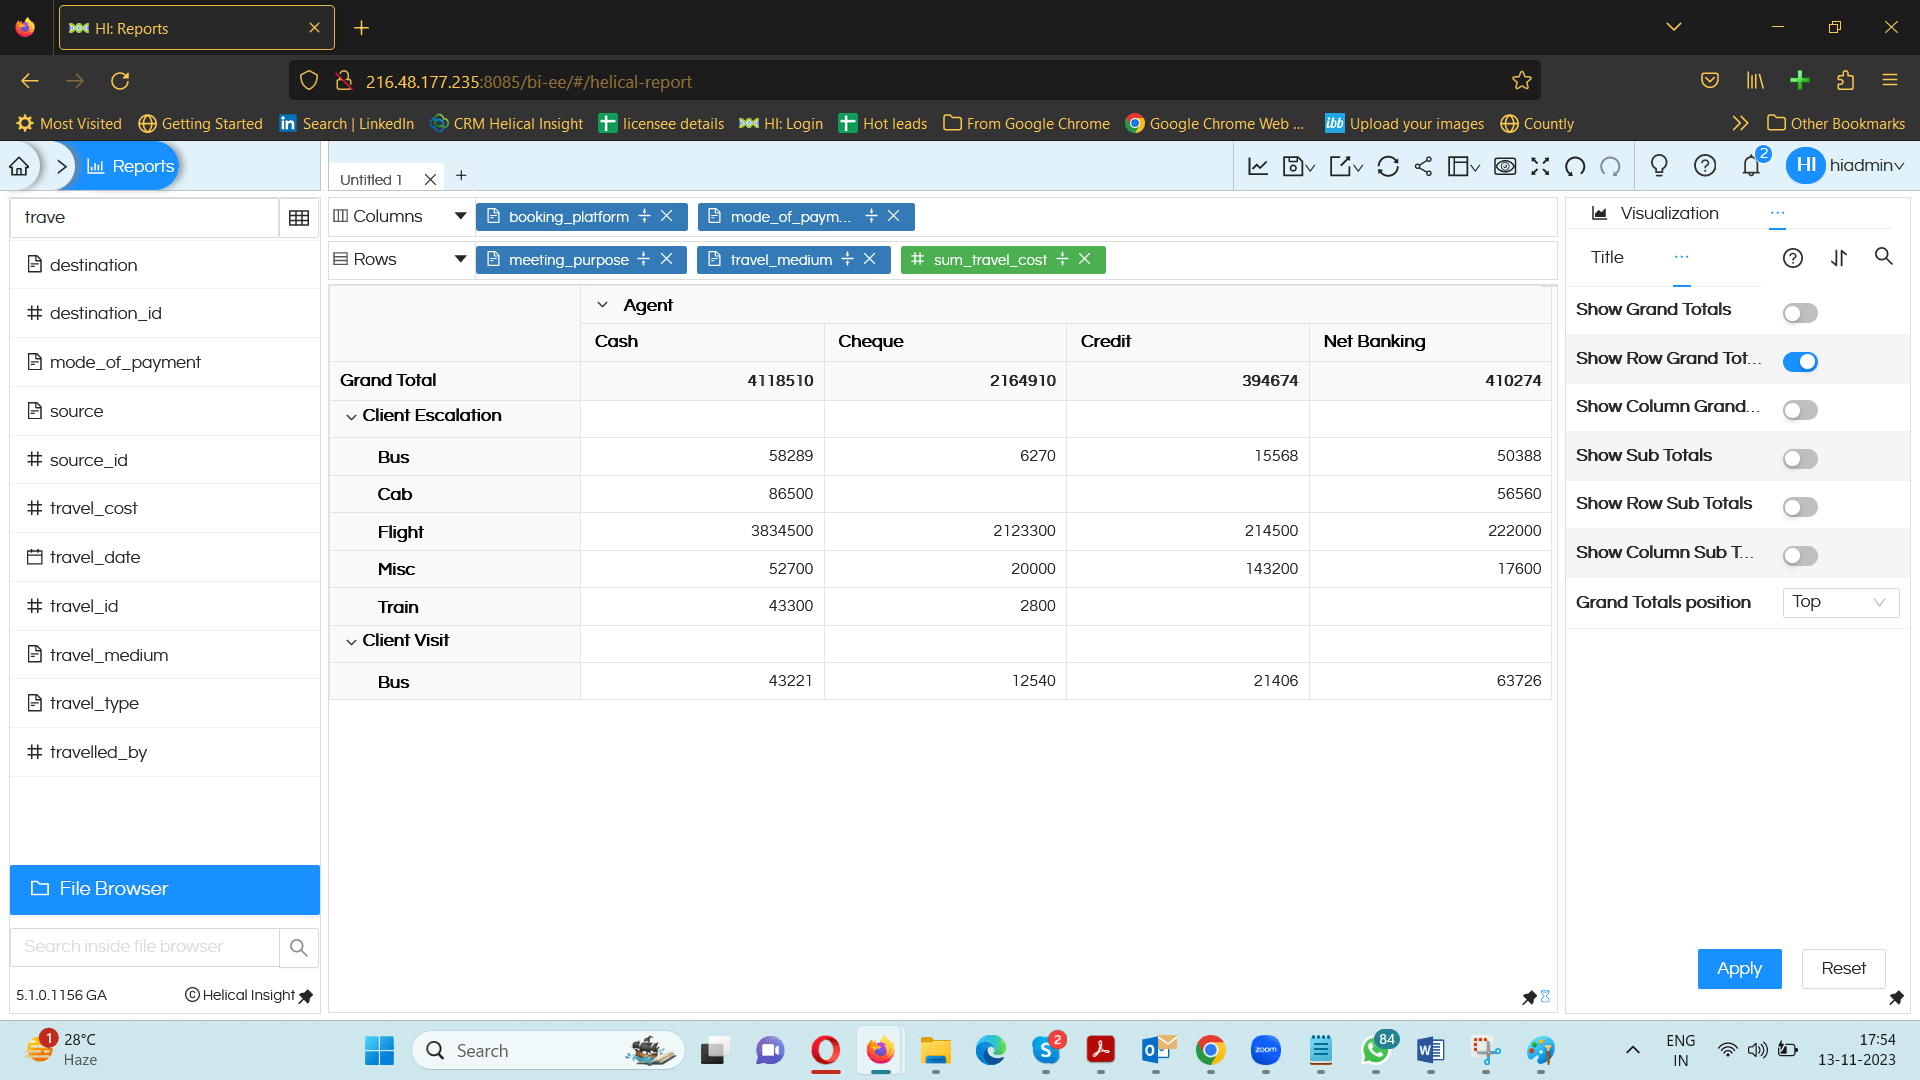
Show Row Grand Totals:Using this enables addition of all the rows which is visible. Again its position can also be set as Top or Bottom using the Top or Bottom option of Grand Totals Position.
Show Column Grand Totals: Using this enables addition of all the columns which is visible. Again its position can also be set as left right (Top) or right side (Bottom) using the Top or Bottom option of Grand Totals Position.

Show Sub Totals: This option will enable subgroup totals at both row level and column levels as shown in the below image.
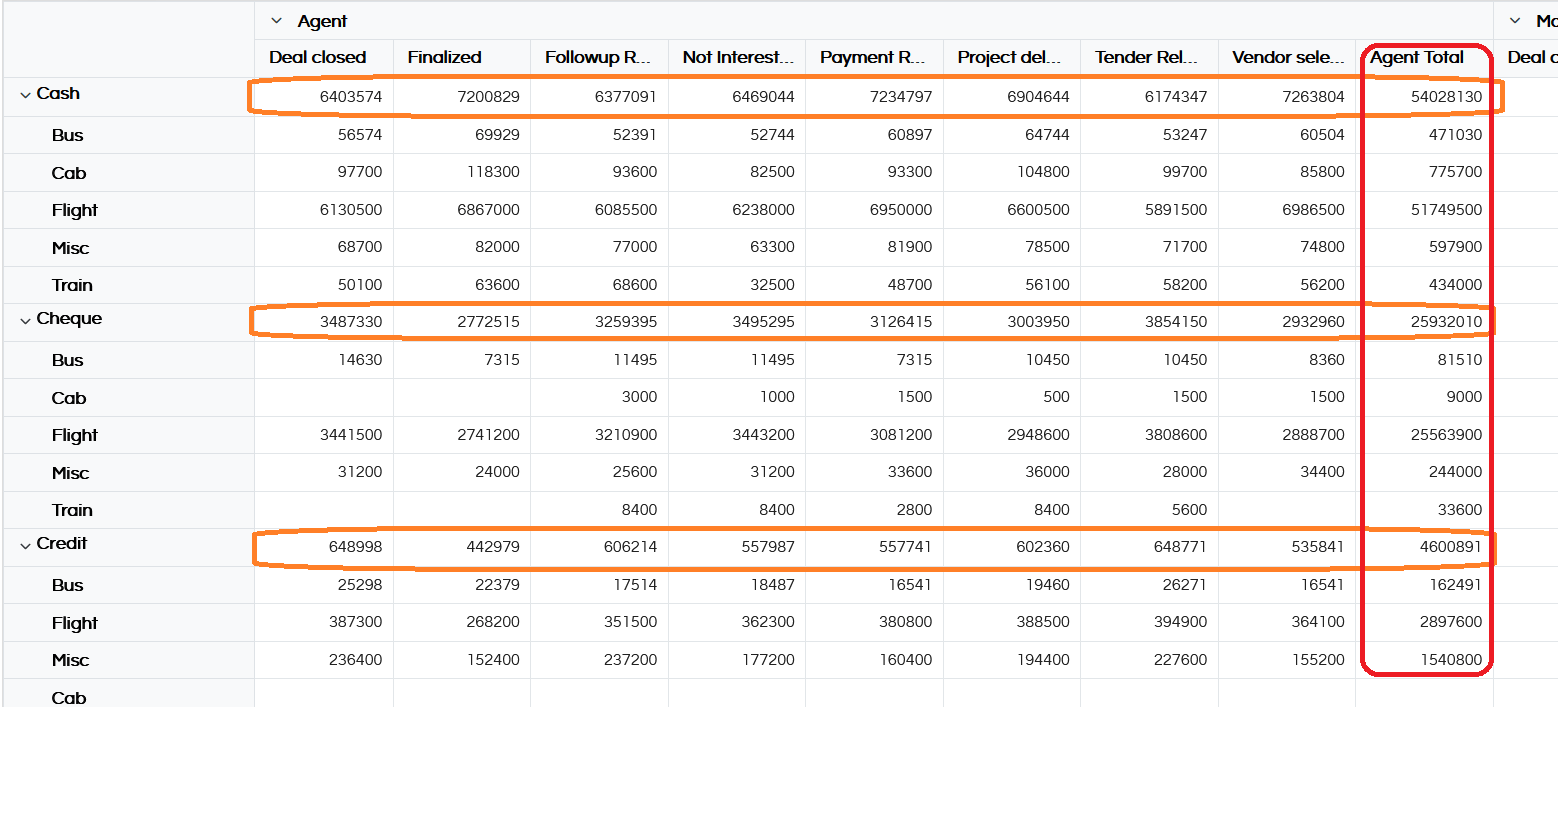
Show Row Sub Totals: Using this enables addition of all the sub groups of row values which is visible. For example in below image there are 3 groups and we can see that at the top row it is showing addition of those as well. i.e. Agent and MakemyTrip and it has created those two sub groups addition as shown in the image.
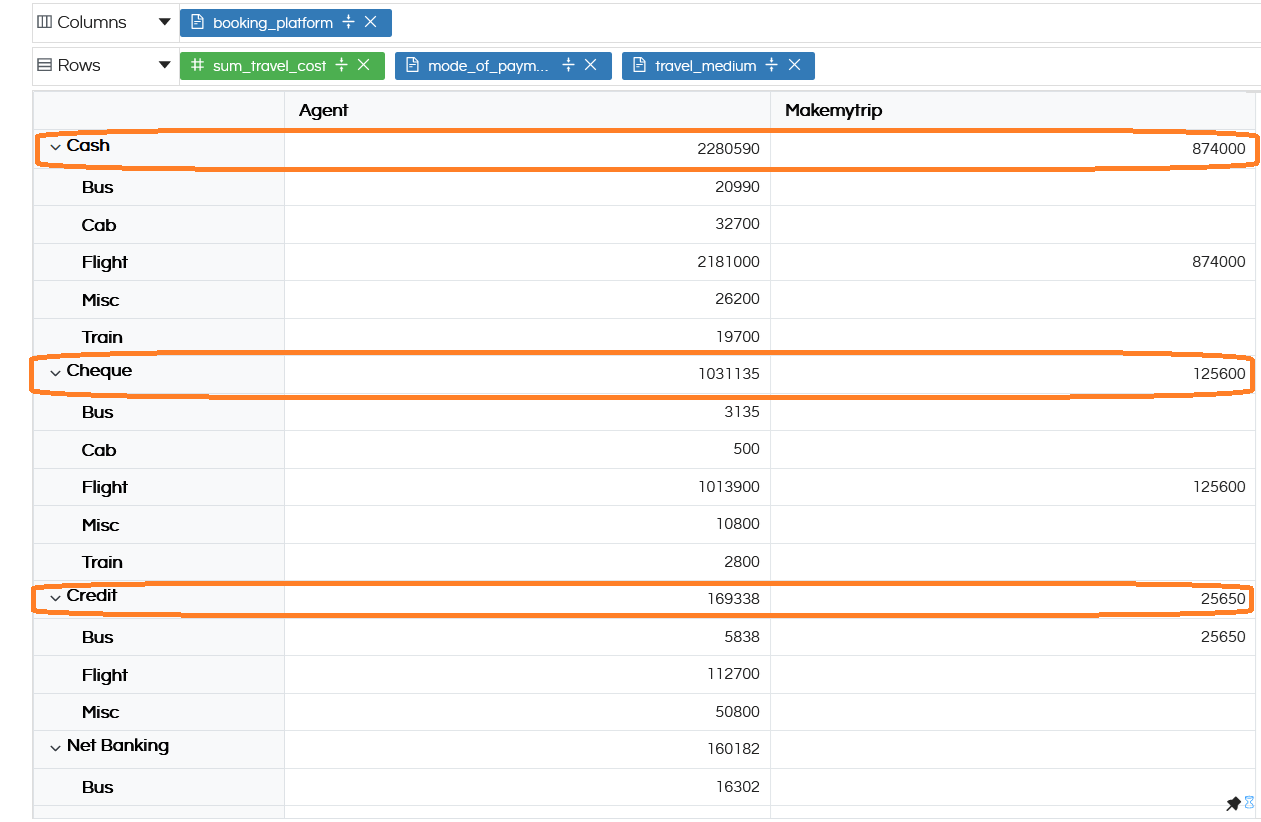
Show Column Sub Totals: Using this enables addition of all the sub groups of columns values which is visible. For example in below image there are 2 groups i.e. Agent and MakemyTrip and it has created those two sub groups addition as shown in the image.

Note: Please note that the calculation will work on aggregate functions as expected like Count, Sum, Min, Max, etc. However, in case of Average it will give the average of the individual values, which might not be the accurate value. Please use it as per the limitation of the data extracted from database.
Collapse: Using this you can collapse the column or rows or both by default. You can again expand anytime you want
.
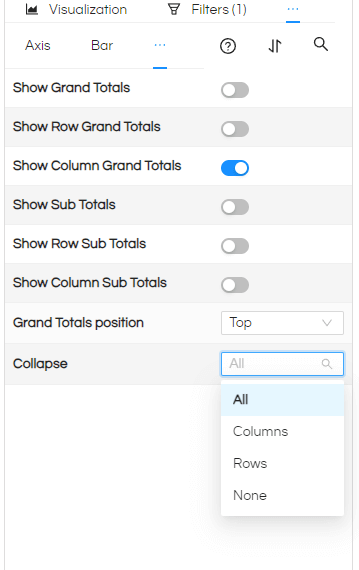
Here In the dropdown, you can select columns or rows or both or none to be collapsed by default. For example, in the below image, we have selected all to be collapsed so this is how it looks.

If we want to expand them, we can do that by clicking on the arrow sign( > ) in front of columns or rows.
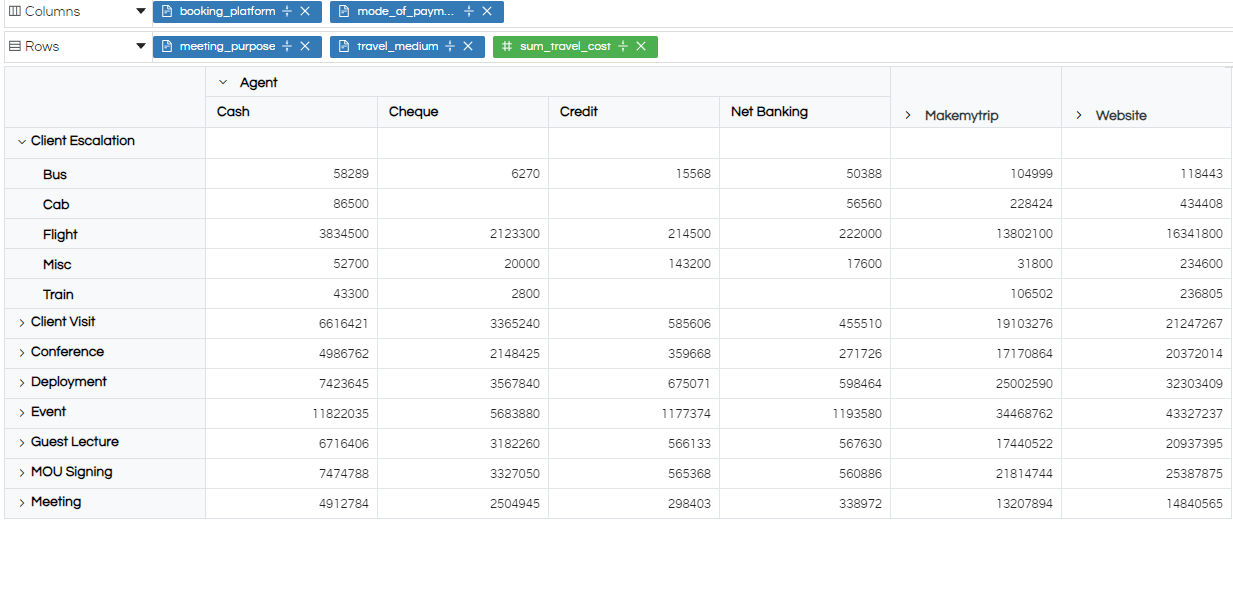
If we select Columns from the dropdown then by default the columns will be collapsed below is how it looks :
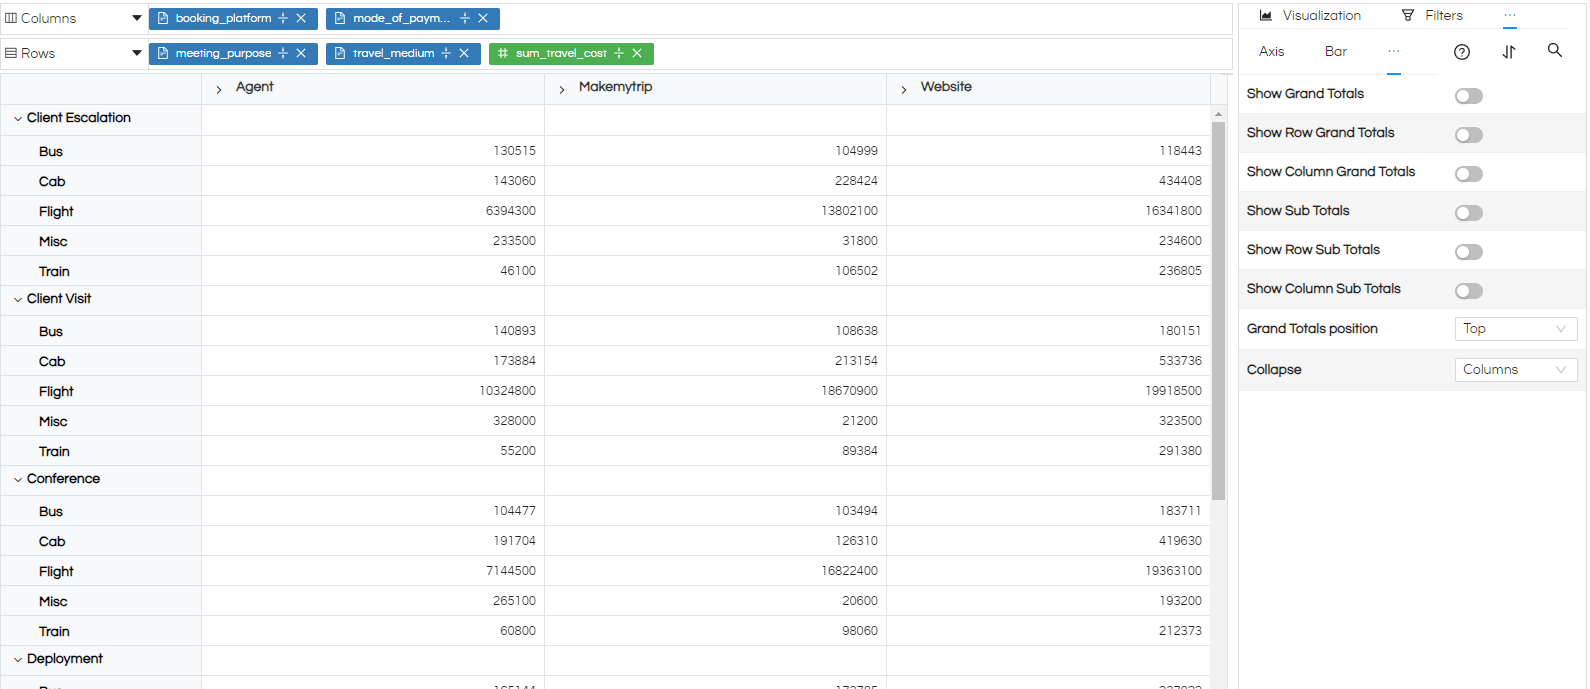
If we want to expand them, we can do that by clicking on the arrow sign( > ) in front of the columns.
If we select Rows from the dropdown then by default the rows will collapse below is how it looks :

If we want to expand them, we can do that by clicking on the arrow sign( > ) in front of the rows.
Be default in the dropdown None is selected.
