Visualization Framework (VF), is a framework that is used to generate different visualizations. The VF accepts JavaScripts to generate the required visualization. The Reports module provides some predefined visualizations and also allows users to add newer, often required visualizations to that list.
However, if the user requires to use a certain visualization for an exceptional case, the said visualization need not be added to the list of existing visualization options, instead can be stored separately and called only for the said case.
How to use Visualization Framework (VF) in HI V5.1.0 :
Visualization Framework (VF) can be used in ‘Reports’ module inside “Visualization” tab at report level.To create customizable visualizations using VF component user need to connect to metadata and add fields into the Column or Rows shelves. Now to create any visualization user need to write the script in VF editor area and click on ‘Apply’ button. User can create VF reports by using Report data and Static data well.
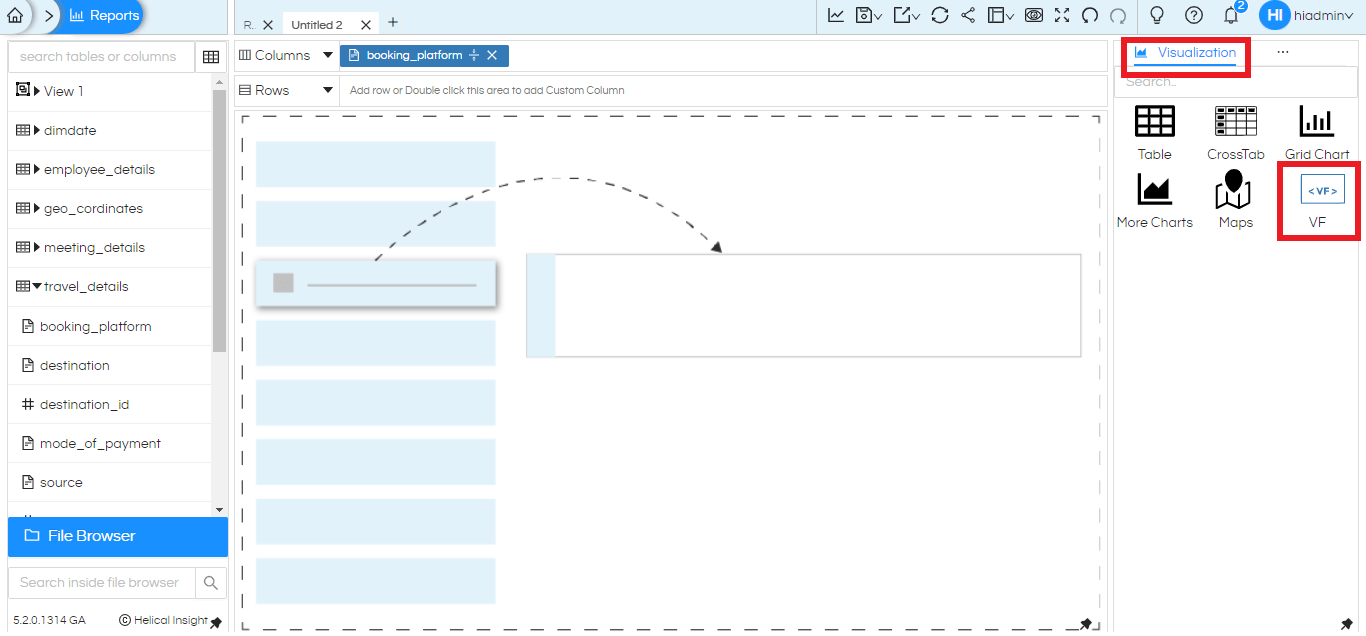
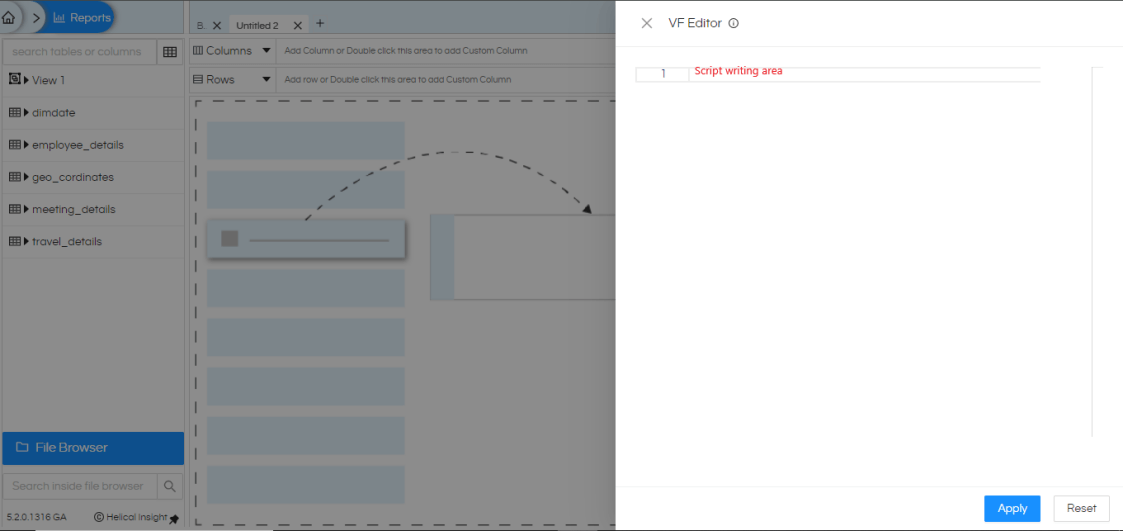
User can write any JavaScript function inside editor and execute it, please make sure whatever function you’ll write in the editor should return jsx/html in order to print something in the rendering area of report.
Below is example to create ‘Line Chart’ of Antd library using VF :
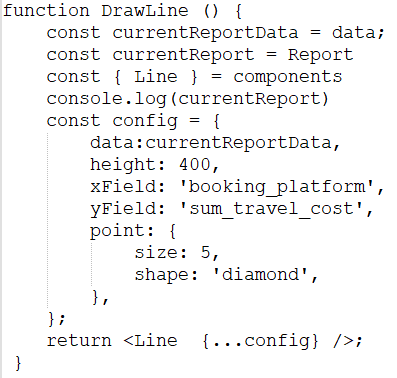
Note: To generate this visualization user need to add ‘booking_platform’to Column shelves and ‘sum_travel_cost’to Row shelves.
The above example will create a Line chart using the data present in the report. In this :
data is assigned to a variable , this data is present in hreport and VF has access to it
report is assigned to a variable, this report is present in hreport and VF has access to it. components is an instance to VF , it contains all the components that are used in hreport and you can get anything from it and use it in your chart.
Points to be remember while writing scripts in VF :
1. whatever function you’ll write in editor , please make sure that the top most parent function should be a normal javascript function and it should always written some jsx/html, you can return null as well , i.e it should be like
function abc(){ return <h1>hello world!</h1>} ,
2. if you want to import something then you’ll have to get it from components, components is the instance to this editor which contains every possible component/chart of the libraries that we are using in our application . i.e. antd, antd charts , muze charts etc.
you can import something like this –
function abc(){
                             const {Line} = components,
                              ...
                          }
similarly we have two more instances : “report” and “data” report is the current active report of the application and data is the json object of the data that is being used in the report.
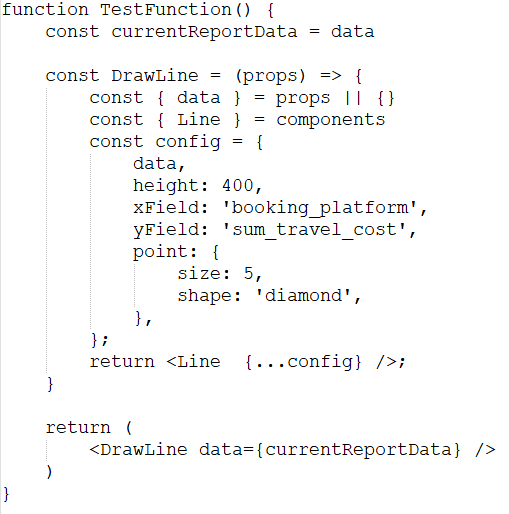
3. The top most parent function will be a normal function of js , i.e it starts with function keyword (This is the limitation of the library that we are using for VF , and in future it’ll be fixed) , but you still can use the other functions such as arrow function but that you can do inside the parent function only.
For.Eg :
Below are the few examples of visualizations which are created by using Visualization Framework (VF) :
Example 1 –
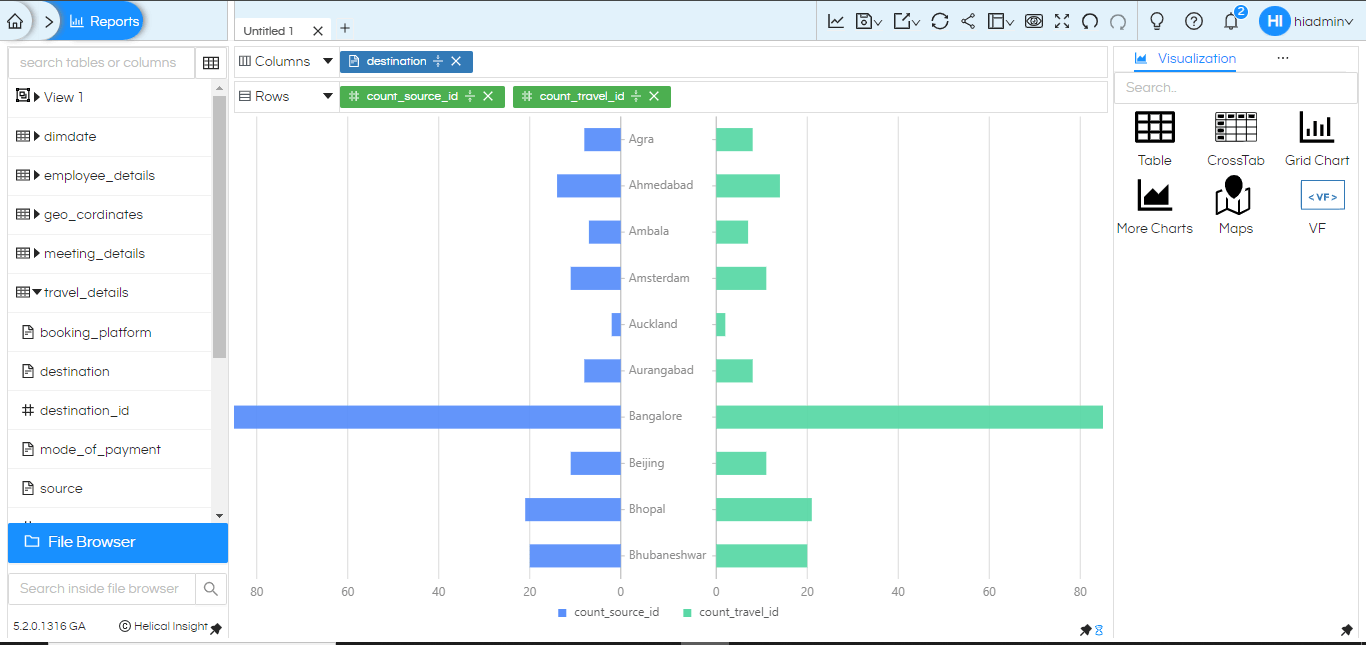
Visualization Name : BidirectionalBar
Library Used : Antd
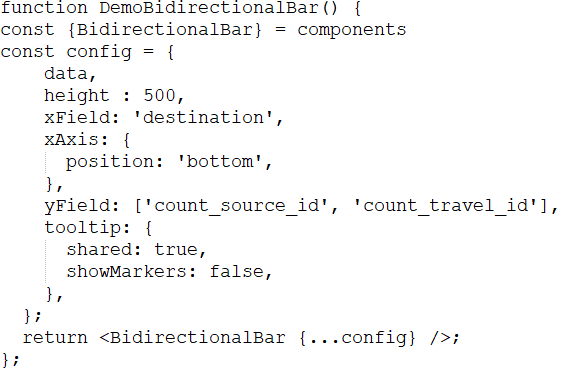
Note :To generate this visualization user need to add ‘destination’ to Column shelves and ‘count_source_id’ and ’count_travel_id’to Row shelves.
Generated visualization :
Example 2 –
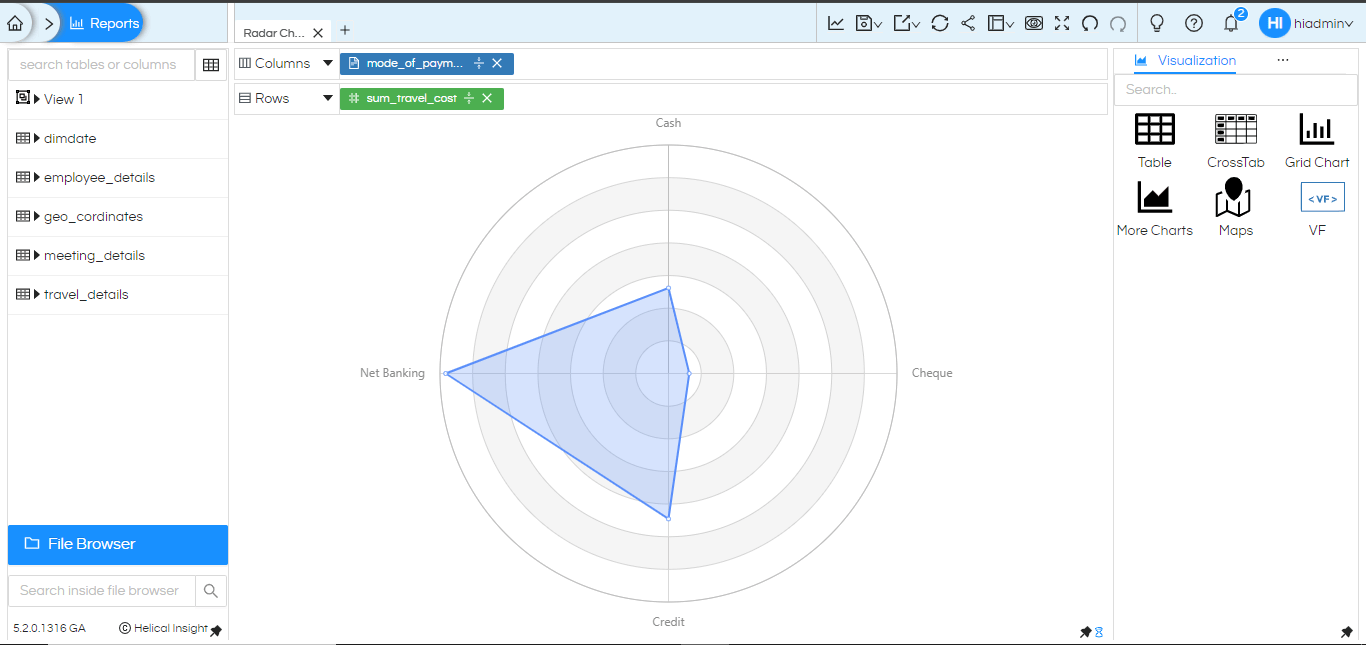
Visualization Name : Radar
Library Used : Antd
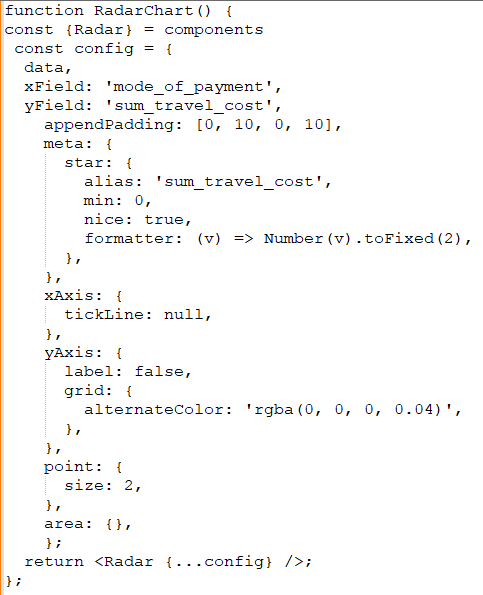
Note: To generate this visualization user need to add ‘mode_of_payment’ to Column shelves and ‘sum_travel_cost’to Row shelves.
Generated visualization :
Visualization Name : Bar
Library Used : Muze
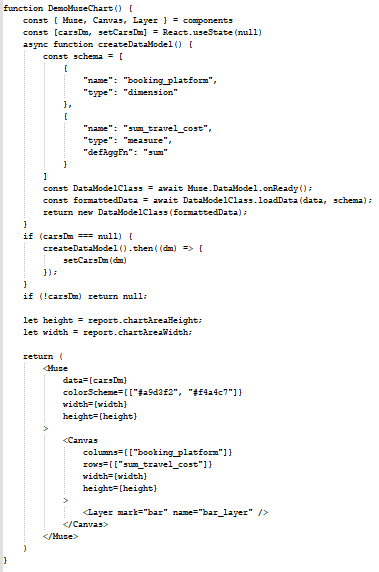
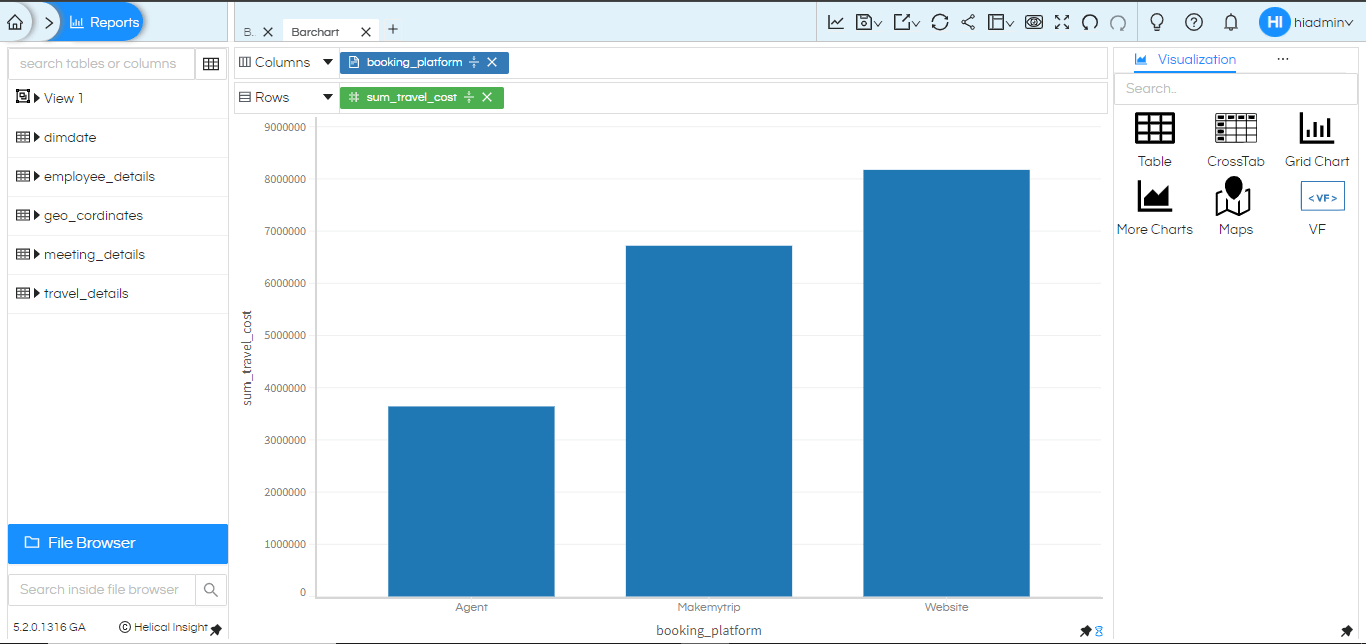
Note: To generate this visualization user need to add ‘booking_platform’ to Column shelves and ‘sum_travel_cost’to Row shelves.
Generated visualization :
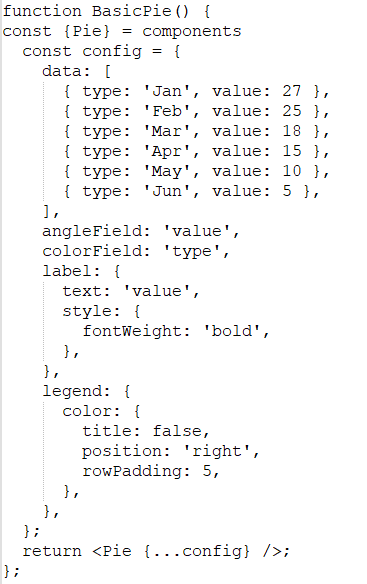
Example to create VF reports with Static Data :
Generated visualization :
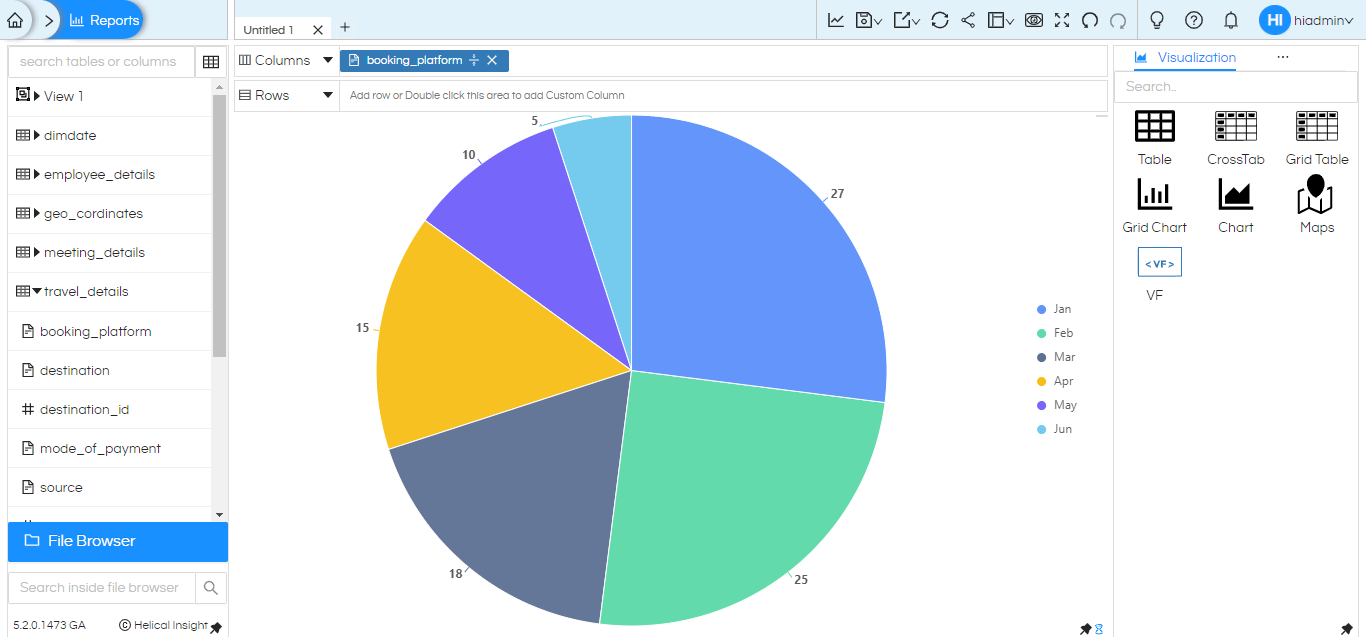
Note :To create VF report with Static data user needs to connect to metadata and add any field to column or row shelve.
How to use Default tooltip,Marks,Report properties and Interactivity with VF reports :
To enhance the chart creation and to use default functionalities from Report module user can use below helper functions in VF script.
1. Function to use default tooltip in VF report
const {getTooltip} = helperFunctions
2. Function to use Report properties in VF report
const {getPropertiesConfig} = helperFunctions
3. Function to use Marks in VF report
const {getPropertiesConfig} = helperFunctions
4. Function to enable interactivity in VF report
const {enableInteractivity} = helperFunctions
Below is the example of how to use above helper functions in VF reports :
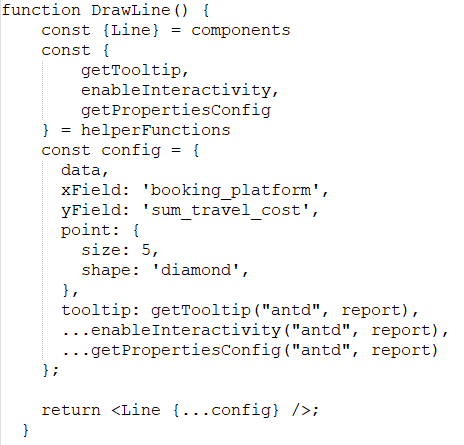
Note: Above is the example from Antd chart so in return it is used (“antd”, report) in helper function, for muze library charts we need to return (“muze”, report).
You can create the other examples from Antd and Muze library with VF in HI application.Examples are present on below websites :
Antd charts :
https://ant-design-charts.antgroup.com/en/examples
Muze chart :
https://github.com/chartshq/reactmuze/tree/master/examples/src/Examples
Thank You
Kedar Ingale
Helical Insight
