In the ‘Report’ module of our Helical Insight, the ‘Map’ property stands out as a versatile feature for personalizing map visualizations to meet specific user requirements. This feature is equipped with several functionalities. These capabilities ensure that users have the flexibility to tailor their map visualizations to align perfectly with their reporting needs.
1. Set the map styles to the map report
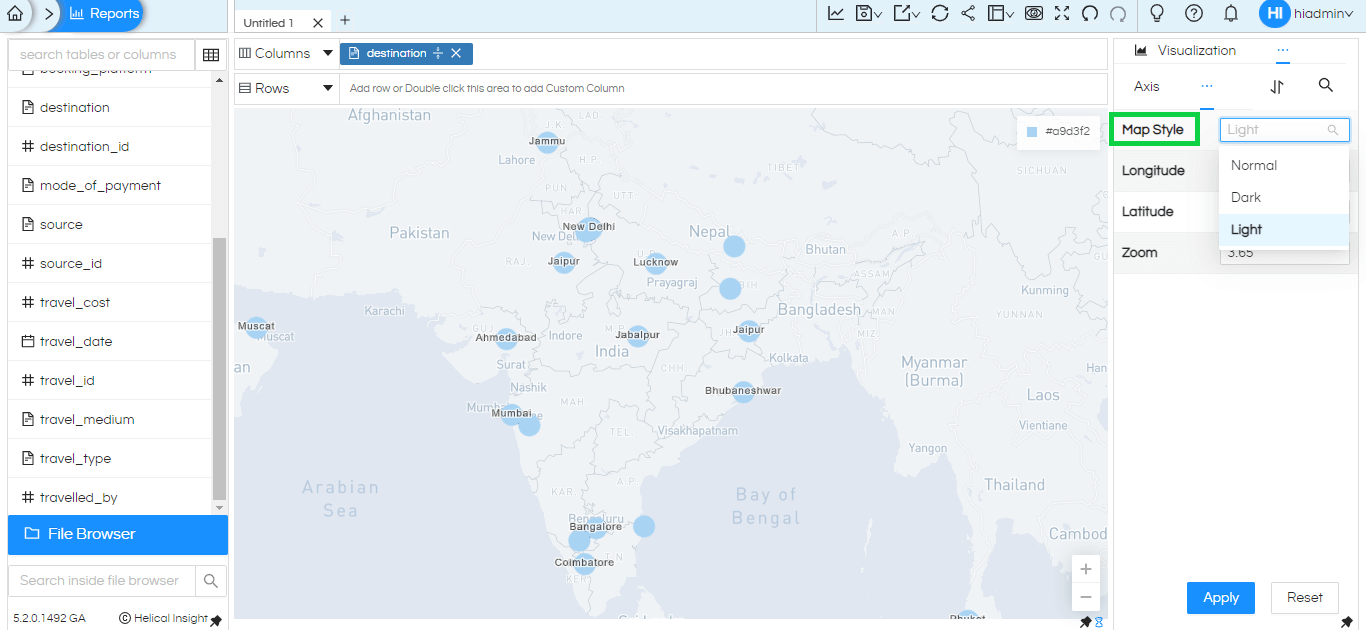
User can set three different style to their map report as per requirement to change the background color of map.There are three map style available in the Map property.By default Normal style is applied to map report.
Normal, Dark and Light are available styles which user can apply as per choice.

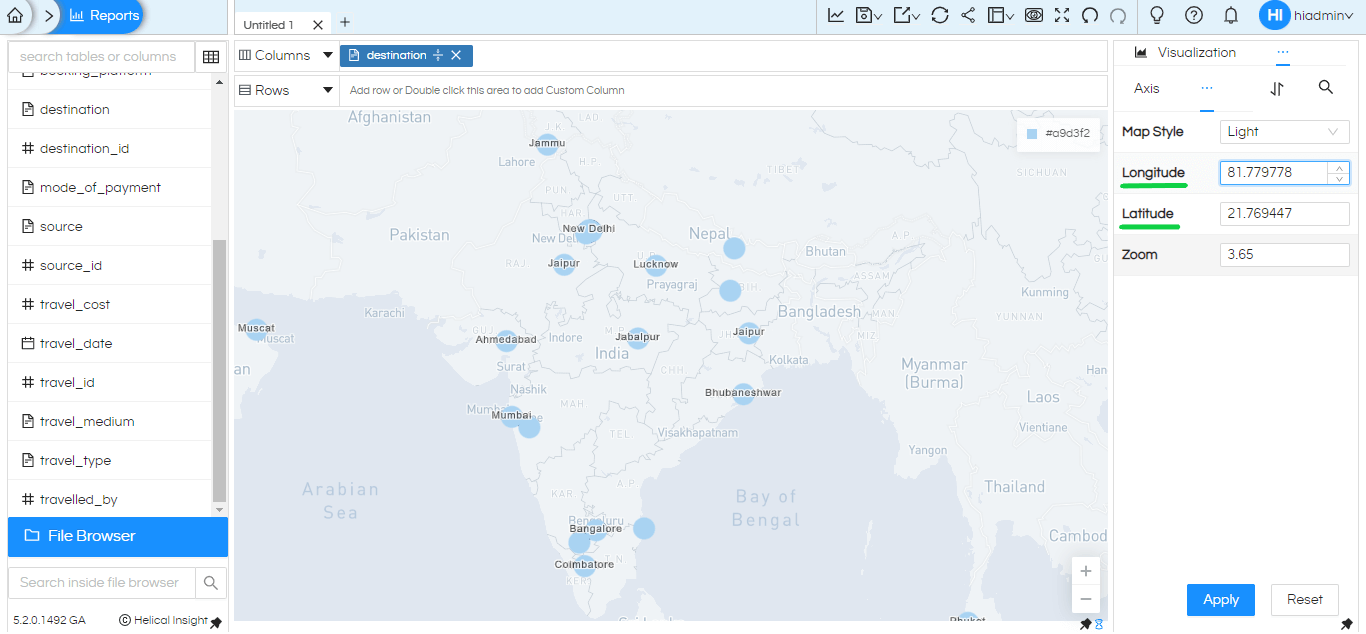
2. Set the Longitude and Latitude value to the map report
By using this option user can input longitude and latitude values to generate a map report according to provided coordinates. By using this option user can visualize specific locations which he want.Ensure that the input values are valid longitude and latitude coordinates.

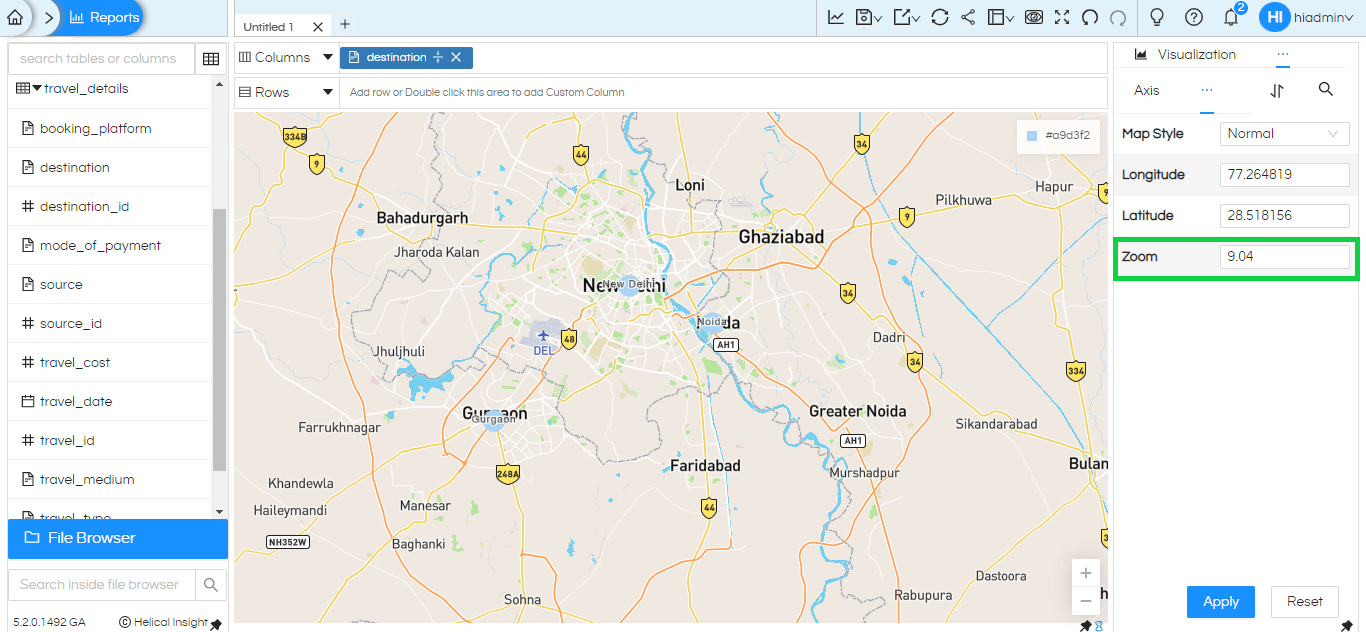
3. Set the Zoom level of map report
By using Zoom option in Map property user can adjust the zoom level of the map through two methods :either by inputting a value into a input box or by utilizing the mouse scroll bar or plus/minus icons on the report interface. This zoom level range spans from 0 to 22.

The ‘Map’ property within the ‘Report’ module is a testament to commitment to providing a user-friendly and customizable experience. These features ensure that users can convey their data in a way that is both accurate and aligned with their unique presentation style, making it an invaluable asset for any report that relies on geographic data visualization.
Reach out on support@helicalinsight.com in case of any questions.
Thank You
Kedar Ingale
Helical Insight
