In the ever-evolving world of data analytics, finding the right tools for visualization and reporting is crucial. While Power BI by Microsoft is a popular choice, several open-source alternatives offer powerful features without the associated costs. In this blog, we will explore the top 5 open-source alternatives to Power BI, each with its unique strengths and capabilities.
Discover Helical Insight – the ultimate open source alternative to Power BI. Try it now for free!
Power BI is a robust business analytics tool developed by Microsoft, known for its interactive dashboards, advanced data visualizations, and seamless integration with various data sources. It enables users to create insightful reports and share them across their organization. However, the licensing fees and potential limitations in customization drive many to seek open-source solutions. Our top 5 alternatives will provide options for those looking to harness powerful data analytics while maintaining flexibility and reducing costs.
Key Factors to Consider When Choosing an Power BI Alternative
- Compatibility: Check the integration capabilities with your existing systems. Ensure the alternative is compatible with your data sources and formats to streamline data import and export processes.
- Scalability: Evaluate the user interface and overall usability. Check if the tool offers drag-and-drop features and intuitive navigation.
- Ease of Use: Evaluate the tool’s ability to handle increasing data volumes. Assess its performance with growing user numbers and data complexity to ensure it can scale with your business.
- Customization: Examine options for personalized dashboards and reports. Evaluate the flexibility in adapting the tool to your unique business needs and workflows.
- Collaboration: Ensure the tool has features for team collaboration and sharing. Check for real-time data sharing and co-authoring capabilities that facilitate teamwork and information dissemination.
- Security: Verify the data encryption and access controls offered by the tool. Ensure it complies with industry standards and regulations to protect your data and maintain privacy.
- Cost-Effectiveness: Compare different pricing models and the total cost of ownership. Consider the value for money based on the features, support, and benefits provided by the tool.
- Support and Community: Assess the availability of customer support and technical assistance. Check for an active user community that can provide peer support and share best practices.
- Performance and Reliability: Evaluate the tool’s speed, uptime history, and overall performance. Consider performance metrics and user reviews to ensure reliability and efficiency.
- Visualization Capabilities: Review the range and quality of data visualization options. Ensure that the visualizations are interactive, customizable, and suitable for your business needs.
- Data Processing and Analysis: Assess the tool’s data processing speed and analytical capabilities. Ensure it supports advanced analytics and machine learning to provide deeper insights.
- Mobile Access: Check for mobile compatibility and the availability of a mobile app. Ensure a seamless experience across devices to facilitate access to data on the go.
- Vendor Reputation: Research the vendor’s history, market presence, and reliability. Look for customer testimonials, case studies, and independent reviews to gauge their reputation.
- Trial and Evaluation: Take advantage of free trials and demos offered by the vendors. Conduct thorough evaluations to ensure the tool meets all your requirements before making a decision.
Top 5 Open Source Alternatives to Power BI
1. Helical Insight

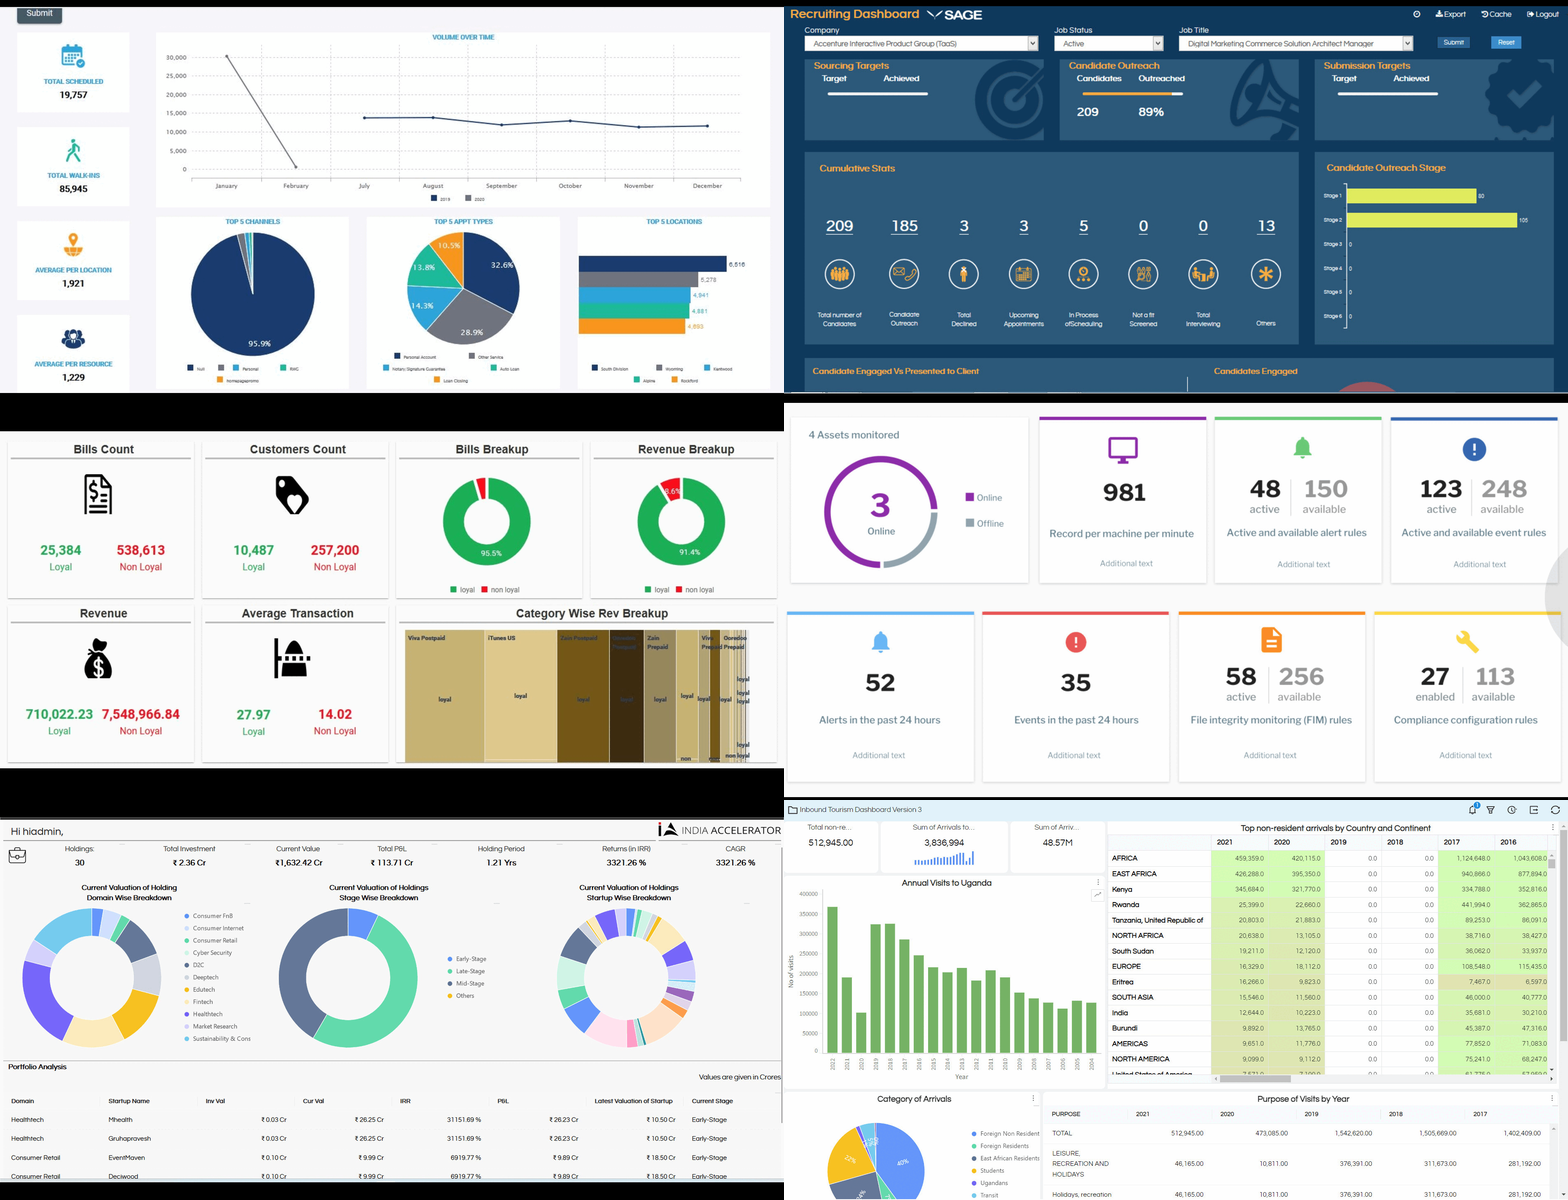
Helical Insight is emerging as a leading open source alternative to Power BI, offering a robust and versatile platform for data analytics and business intelligence. With its cutting-edge features, customizable architecture, and user-friendly interface, Helical Insight caters to organizations of all sizes, enabling them to harness the power of their data effectively. Unlike many proprietary solutions, Helical Insight provides unparalleled flexibility, allowing users to tailor their analytics environment to their unique needs and preferences. This open-source solution not only reduces costs but also empowers businesses with complete control over their data and insights, making it a top choice for companies seeking a comprehensive and adaptable analytics tool.
Discover Helical Insight – the ultimate open source alternative to Power BI. Try it now for free!
Key Features
- self service interface for creating reports, dashboards, info-graphs and map based analytics
- Plenty of visualization options with drill down, drill through and inter panel communication options
- NLP (GenAI) based data analysis under development
- support for document kind of printer friendly canned reports also
- exporting
- email scheduling / report bursting
- white labeling
- embedding
- support of various methods of Single Sign On
- Completely browser based application
- On premise installation
- Cloud and mobile support
- Support of various kind of DB, flat files, columnar DB and more
- Caching and pagination
- Support for containers like docker, kubernetes
- Extensive API support
- Extremely developer friendly BI framework
- Flat pricing with various pricing options like perpetual, subscription etc
Please reach out on support@helicalinsight.com for a demo, pricing and POC.

2. Apache Superset

Apache Superset is a modern data exploration and visualization platform. It’s highly extensible and suitable for large-scale data analysis.
Key Features:
- Interactive Dashboards and Reports: Create visually appealing and interactive dashboards that can be easily shared across the organization.
- Scalability: Superset can handle large datasets and complex queries efficiently.
- Customizability: Users can create custom visualizations and dashboards tailored to their needs.
- Wide Range of Visualizations: Offers a variety of chart types and visualizations.
- SQL Lab: An interactive SQL editor for advanced querying and data exploration.
3. Qlik Sense

Qlik Sense is a modern data analytics platform that empowers everyone in an organization to make data-driven decisions. Known for its associative data indexing engine, Qlik Sense allows users to explore data intuitively and uncover hidden insights.
Key Features:
- Associative Data Model: Explore and analyze data from multiple sources without predefined relationships, allowing for more comprehensive insights.
- Self-Service Data Discovery: Empower users to create their own visualizations and reports without needing technical expertise.
- Smart Search: Perform natural language searches across all your data to find insights quickly.
- Advanced Analytics Integration: Integrate with R and Python for advanced statistical and predictive analysis.
- Scalability and Governance: Ensure data security, scalability, and compliance with enterprise-level governance features.
Discover Helical Insight – the ultimate open source alternative to Power BI. Try it now for free!
4. Looker

Looker, part of Google Cloud, is a modern data platform that offers powerful data exploration and analytics capabilities. Looker’s unique modeling layer allows for centralized data definitions, ensuring consistency and accuracy in reporting and analysis.
Key Features:
- Centralized Data Modeling: Define business metrics and data relationships in a centralized model, ensuring consistency across the organization.
- Customizable Dashboards: Create interactive, real-time dashboards tailored to specific business needs.
- Data Integration: Integrate seamlessly with various databases, cloud services, and data warehouses.
- Embedded Analytics: Embed analytics into applications and workflows to provide data insights where they are needed most.
- Collaboration and Sharing: Facilitate collaboration with features like scheduled reports, data alerts, and integrated commenting.
5. Sisense

Sisense is an end-to-end BI solution that simplifies the process of preparing, analyzing, and visualizing complex data. With its in-chip technology and robust analytics capabilities, Sisense helps organizations make better data-driven decisions.
Key Features:
- In-Chip Technology: Utilize in-chip technology for faster data processing and query performance, even with large datasets.
- Data Preparation and Mashups: Easily prepare and blend data from multiple sources to create a unified view of your business.
- AI and Machine Learning: Incorporate AI and machine learning to enhance data analysis and predictive modeling.
- Interactive Dashboards: Develop interactive and customizable dashboards with rich visualizations.
- Scalable Architecture: Scale seamlessly from small teams to large enterprises with a flexible and scalable architecture.
Discover Helical Insight – the ultimate open source alternative to Power BI. Try it now for free!
FAQs: Top 5 Open Source Alternatives to Power BI
What are the Top 5 Open Source Alternatives to Power BI?
The top 5 open source alternatives to Power BI are Helical Insight, Metabase, Apache Superset, Redash, and BIRT.
Why consider Open Source Alternatives to Power BI?
Open source BI tools offer flexibility, cost-effectiveness, and customization options that proprietary tools like Power BI may lack.
Is Helical Insight a strong alternative to Power BI?
Yes, Helical Insight is a powerful open source BI tool with advanced reporting, embedding capabilities, and developer-friendly features.
What makes Helical Insight stand out among Open Source Alternatives to Power BI?
Helical Insight offers a workflow engine, canned reports, role-based access, REST API support, and high customizability—ideal for enterprises and developers.
Are Open Source BI tools suitable for enterprises?
Yes, tools like Helical Insight are enterprise-ready with features like security, user management, and scalable architecture.
Can I embed dashboards using Open Source Alternatives to Power BI?
Absolutely. Helical Insight and other tools support full embedded analytics for seamless integration into apps or portals.
Do these tools support real-time data reporting?
Many open source alternatives, including Helical Insight, support real-time data processing and visualization through scheduled reports and data refresh.
Are there licensing fees with Open Source BI tools?
Most open source tools have no licensing costs. Helical Insight offers both free and affordable enterprise versions with direct support.
Which Open Source BI tool is best for developers?
Helical Insight is highly developer-friendly with support for APIs, plugins, and scripting for customizations.
Where can I explore Helical Insight as a Power BI alternative?
Visit HelicalInsight.com to explore its features, demos, and how it compares to Power BI.
