From version 5.2.3 of open source BI product Helical Insight, trend card has been introduced. In this blog we will learn how to create a Trend Card. It is important that you have read how to create a Card before you learn how to create a trend card.
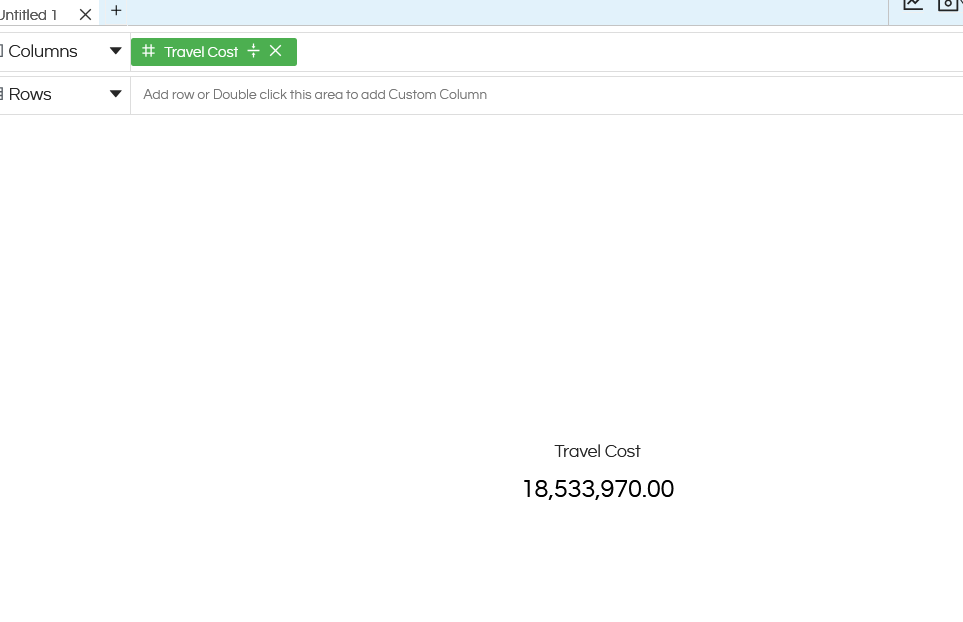
Let us assume that you have created a Card widget like this which is showing a Travel Cost card widget as shown below.
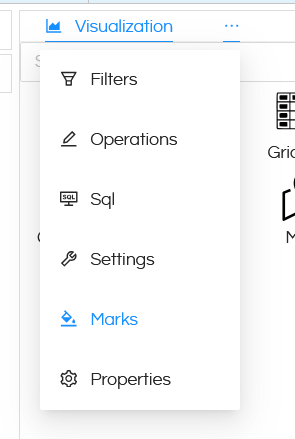
Now go to Marks by clicking on the 3 dots next to Visualization.
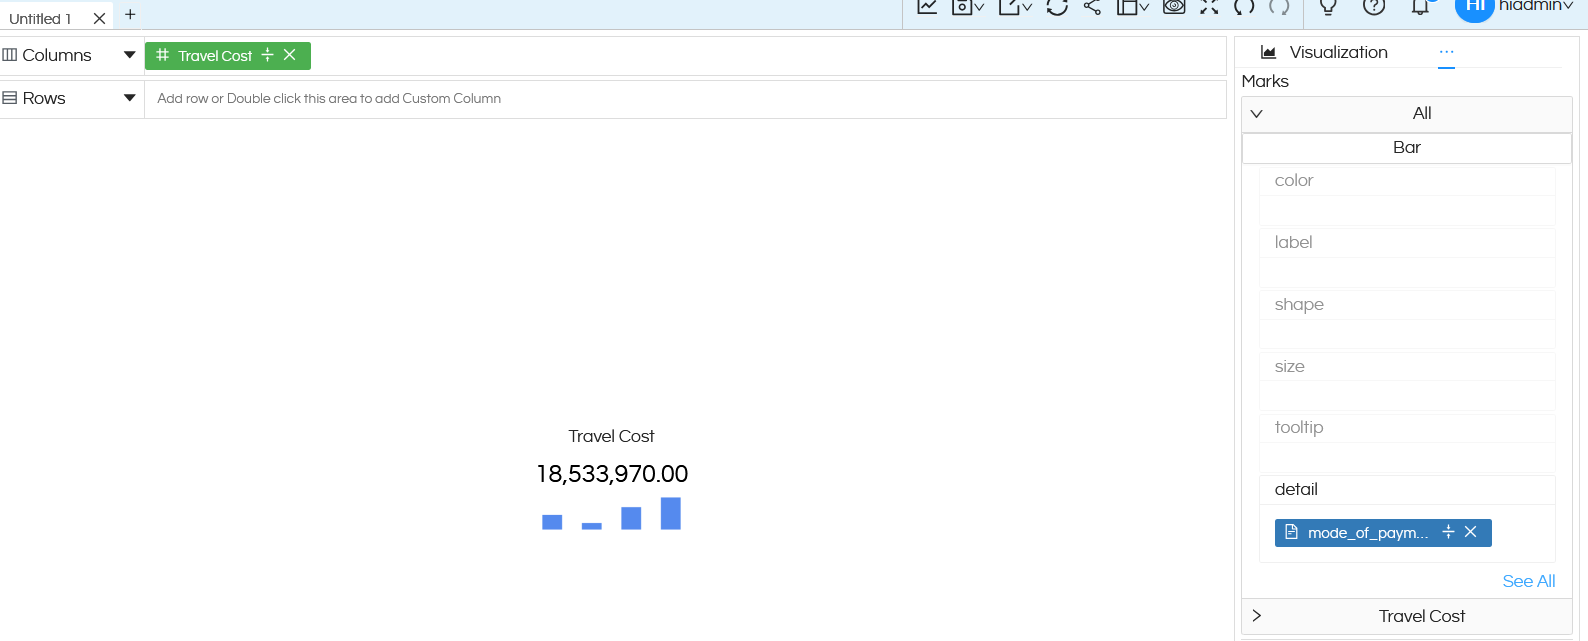
Then you can add a field in the Details. In this case we have added a field called as Mode_Of_Payment which has got 4 values. And thus 4 bars got added below the Travel Cost.
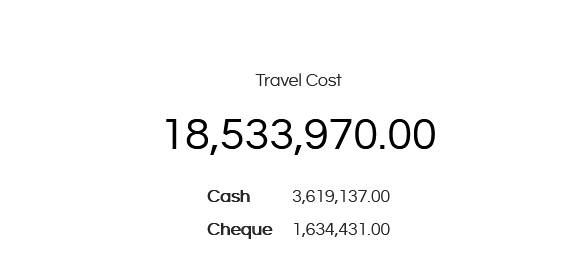
You can click on the Bar and this bar chart below Travel Cost card widget can be changed to others also (like Line, Bar, Area, Table). Line, Bar, Area and Table are relevant. With version 5.2.3 a new option called Table is also added which was not present earlier. Clicking on Table will give the output like below.
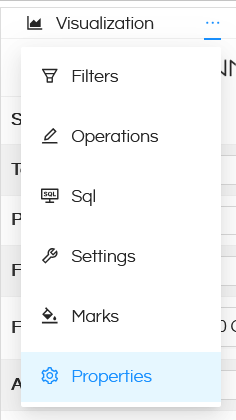
Now to convert this into Trends showing change or percentage change, go to Properties by clicking on 3 dots next to Visualization.
Then click on 3 dots next to Axis and click on Card. Many of the card customization options we have already covered in this blog. With version 5.2.3, 2 new options have been introduced as shown and described below.
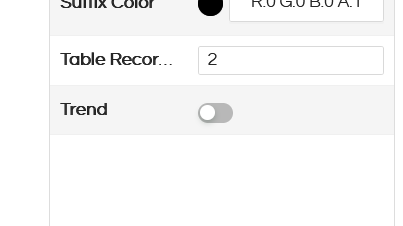
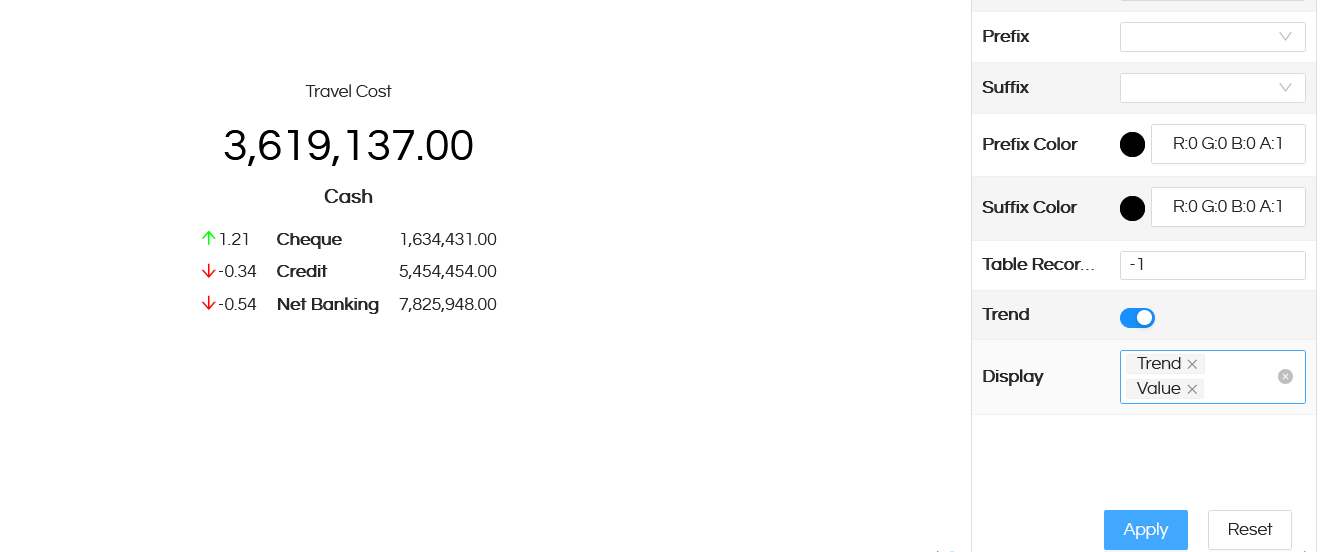
Table Records: Right now you could see that the table below card widget showed 2 values. By changing the values here, it can show more values also. By putting value as -1 it will show all the values.

Trend: Right now the values which are appearing are absolute values. That means the cost of travel is total and then below that it is showing a table breakdown according to the Mode_of_Payment (field which was dragged in the Details section).
But by enabling the Trend option it will show the first value of the table as top and then the other values will be shown as table below it. You can select to display Trend or Value or both. In this example the first value is shown Cash (whose value is 3,619,137) and the other values comes in the table. We can also see by how many times/percentage the value of Cash is more/less as compared to other values of the table.
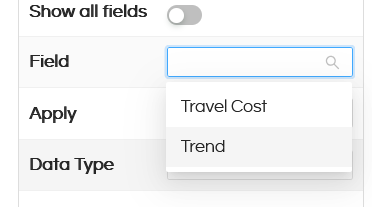
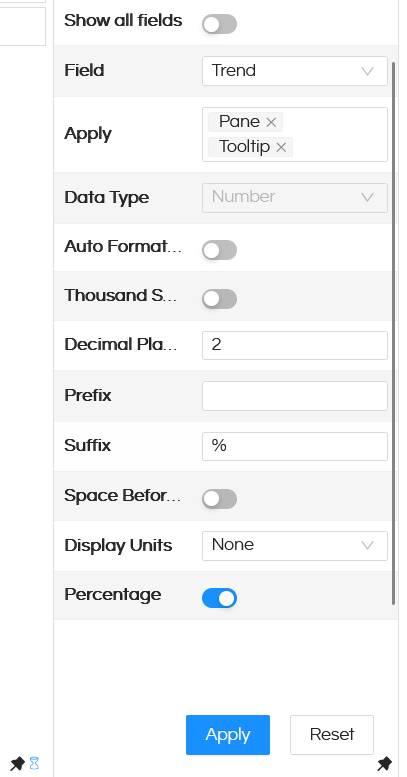
In case if you would like to see those change values as percentage (like instead of 1.21 it should be visible as 121 %), then select the Format property by clicking on the 3 dots next to Axis option.
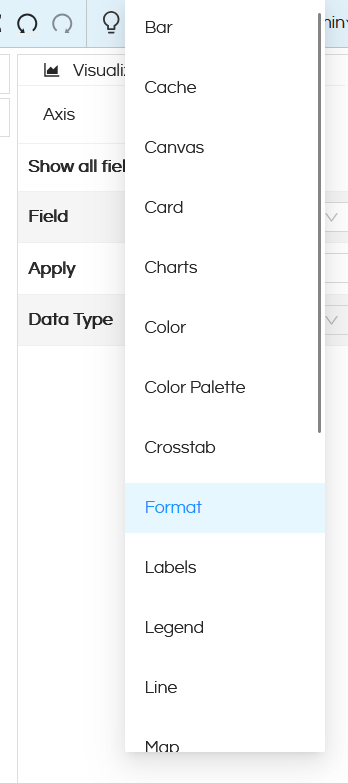
Then from Field select Trend option. You can then enable Percentage. There are also other options like Prefix, Suffix and many other Formatting properties which are present which can be used. To read about the various Formatting properties click here.
Now the visualization appears like below.
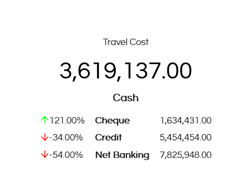
Reading the Card Trend & Explanation of the percentage:
Value of Cash = 3,619,137
Value of Cheque = 1,634,431
We can read this as Cash value is 121% more than Cheque value, 34% less than Credit value and 54% less than Net Banking Value.
