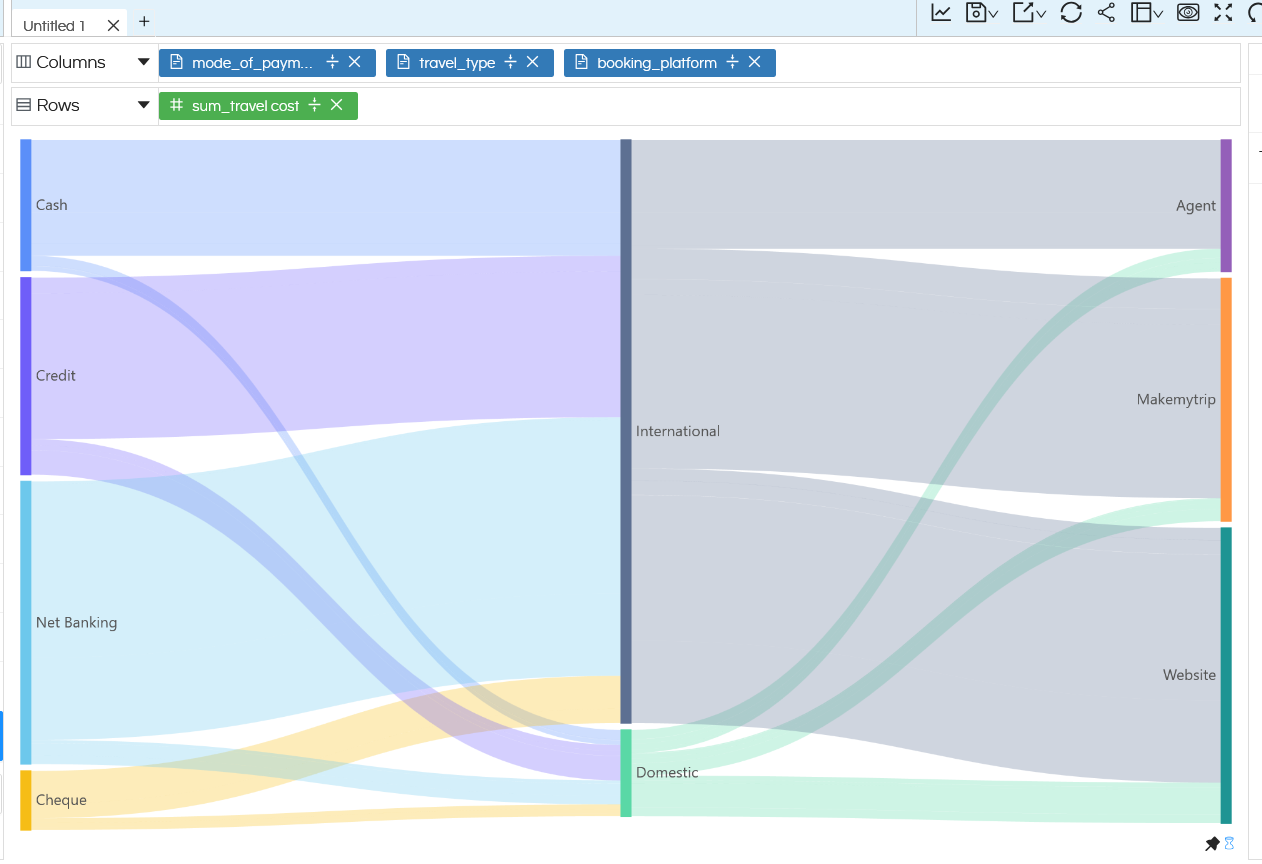
From version 5.2.3 of Open Source BI Helical Insight a new category of charts have been introduced called as Relation Chart. This relation chart can allow you to create charts like Sunburst Chart, Sankey Chart, Treemap charts and Circle Packing charts.
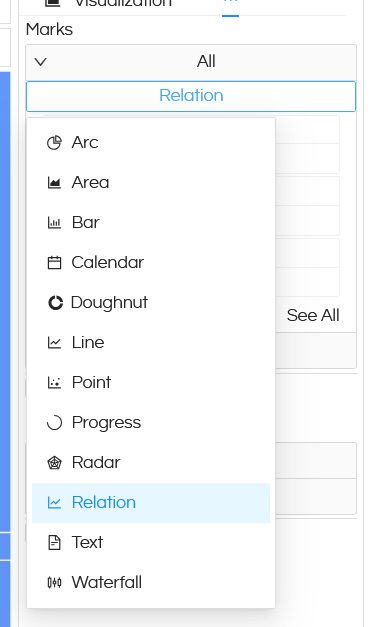
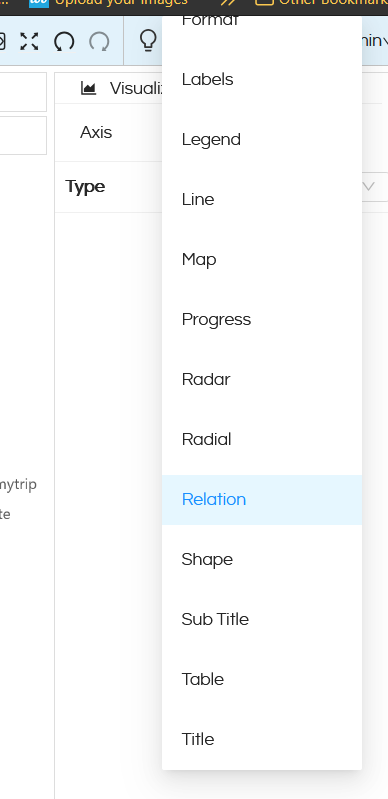
In this blog we will learn how to use Relation chart. You can drag the required dimensions and measures and click on Charts. Go to Marks and in that in the drop down you can see one more additional option called Relation. Note that these Relation chart options only appears in case of Charts and not Grid Charts.
By default it creates a Treemap chart like below. Other functionalities like Marks, Interactivity, Filtering, etc can also be used.
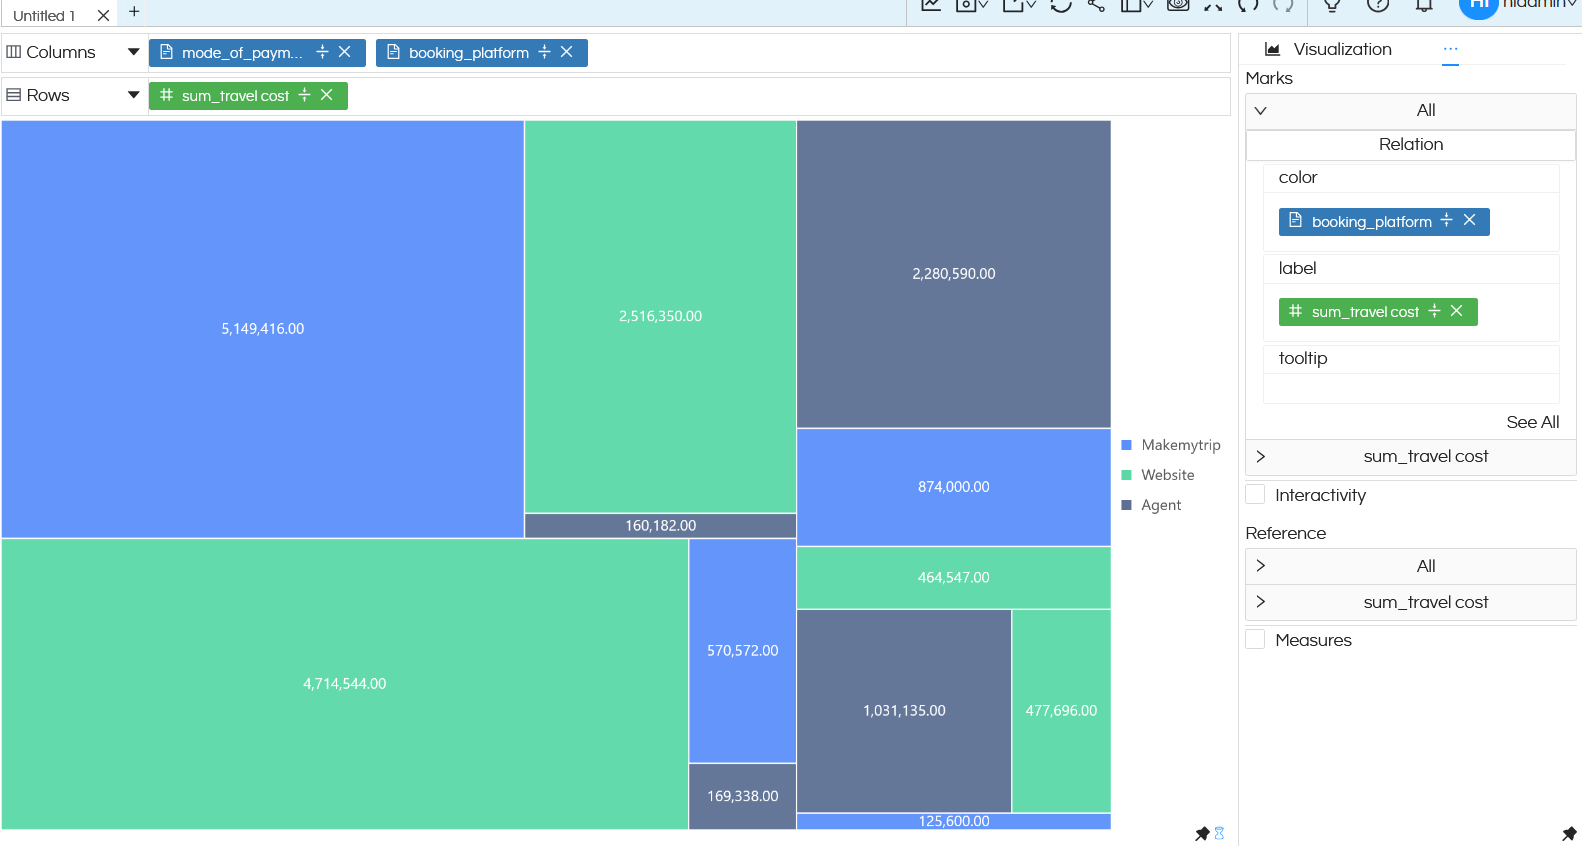
A treemap chart needs at least 1 dimension and 1 measure. You can put anything in Rows and Columns.
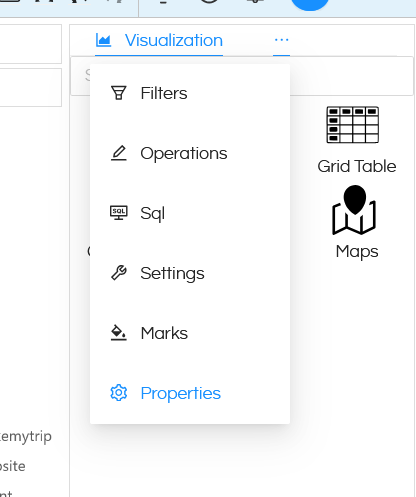
Now click on Properties by clicking on the 3 dots next to Visualization.
Then click on 3 dots next to Axis and go to properties of Relation chart.
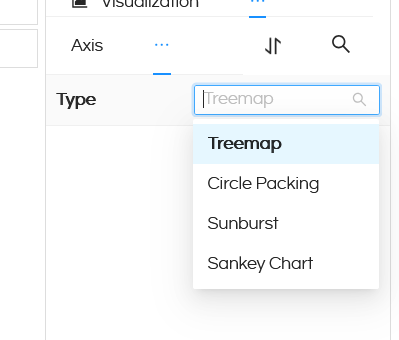
Over here, you will get an option to switch which kind of relation chart that you would like to see.
In the above snapshots we have already seen how Treemap chart looks like.
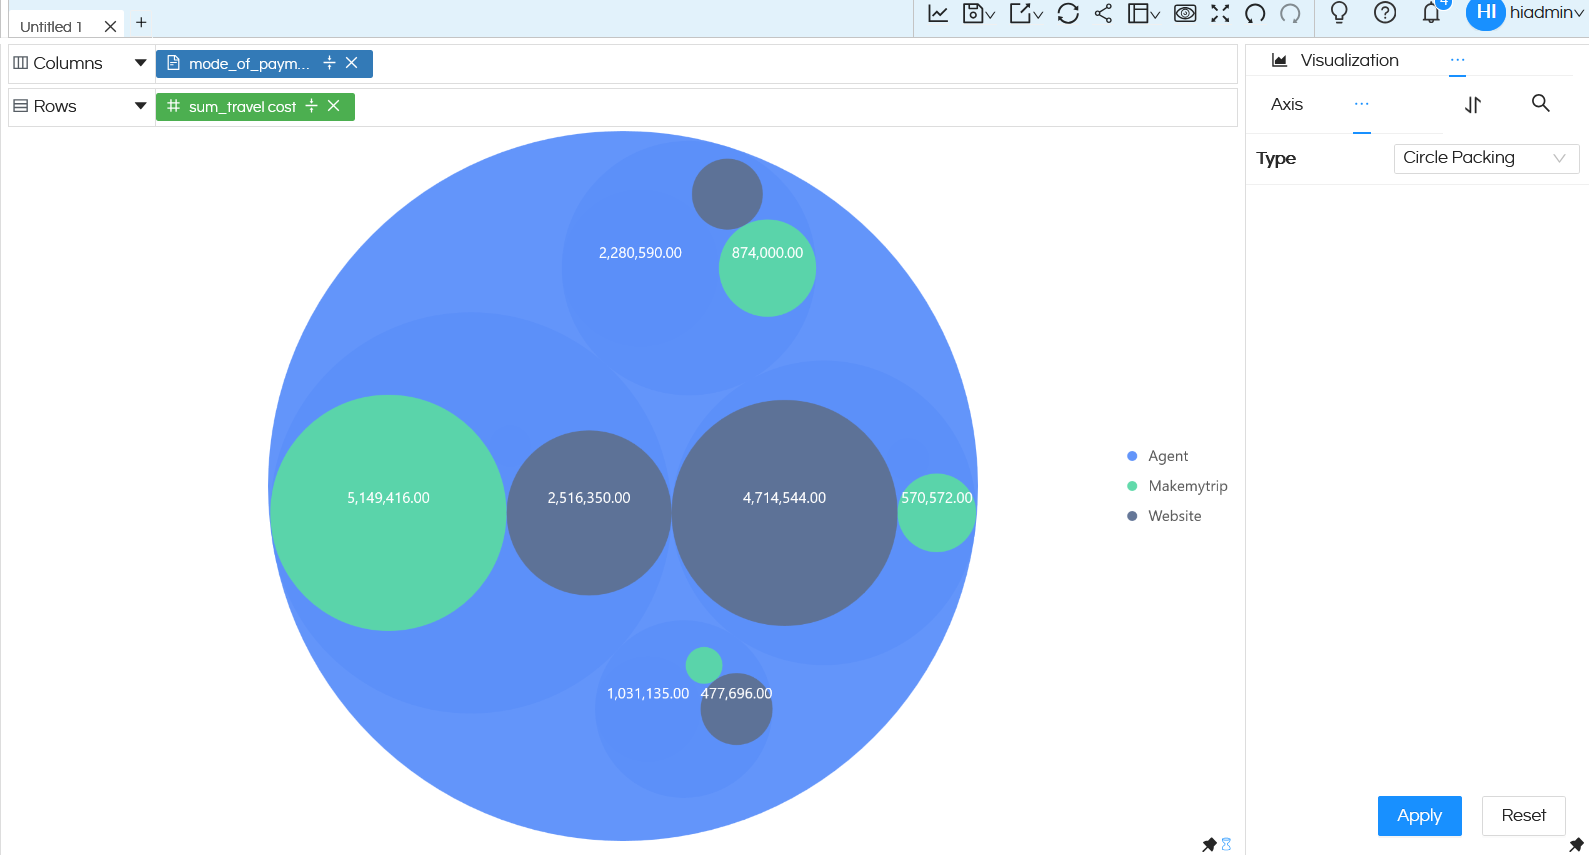
Circle Packing: Below is an example of Circle packing chart. This can also have multiple dimensions. Other features like Marks, interactivity, formatting etc options can also be used.
Sunburst Chart: Below is an image of sunburst chart. You can have multiple dimensions which can create multiple hierarchies. Other features like Marks, interactivity, formatting etc options can also be used.

Sankey Chart: Below is a snapshot of a sankey chart. Other features like Marks, interactivity, formatting etc options can also be used.
