21 April 2025: We are happy to release Open Source BI Helical Insight version 5.2.3. In this blog we are going to explain all the new features and functionalities which have been introduced. This is in continuation to version 5.2.2 which was released in the month of January 2025.
NEW CHARTS:
Below are the newer charts options which are added.
(A) Relation Chart: A new category of charts have been introduced called as Relation charts. These new set of charts can be useful for users who are looking for advanced charting options. This relation charts have 4 sub options which includes Treemap charts, Sankey Charts, Sunburst and Circle packing charts. Read here to learn more about usage of these charts.
(B) Rose and Radial Bar Charts: For users who use Pie charts and Donut charts a lot, with version 5.2.3 we have introduced 2 new sub variants of Pie/Donut charts. These are called as Rose Charts and Radial Bar Charts. To learn more about them click here.
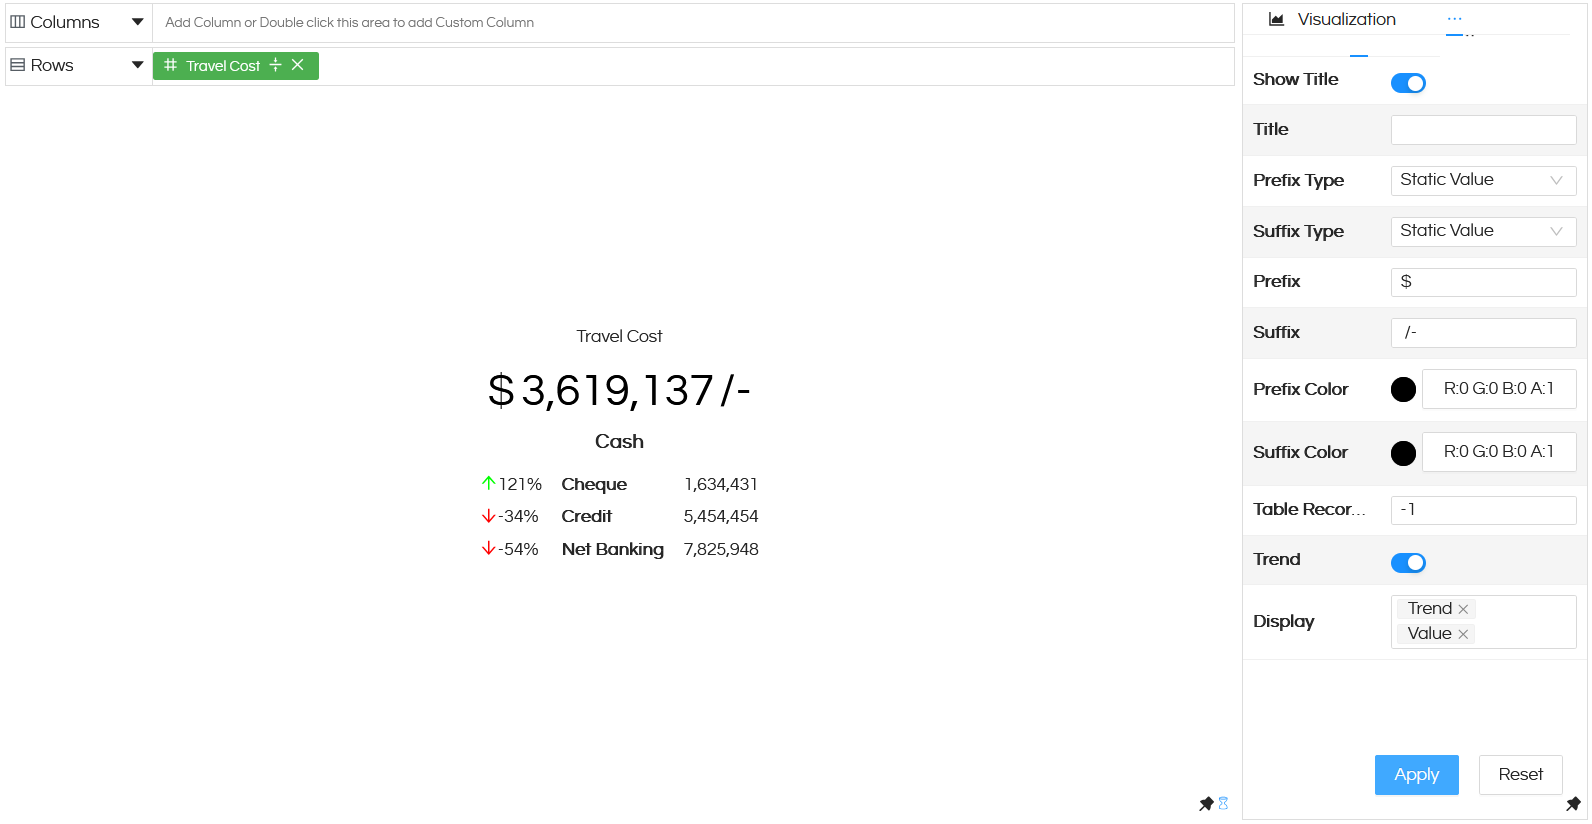
(C) Trend Card: A card or KPI widget is perhaps one of the most commonly used visualization option. It shows a single information in a very quick way. But one of the most common feedback has been to be able to show additional information which include change, percentage change and additional values. Keeping such requirements in mind, we have added a Trend Card option which can allow to create visualizations like below. Click here to learn more about how to use Trend Card.
(D) Date Time Functions: Date/Date Time is one of the most commonly used data types in database. When such fields are used for reporting purposes, very often we need to extract some kind of information (like month, year etc) from them and create reports.
Introduction of a quick Date Time functions allows you to very quickly extract such kind of information from those fields with a single click operations for further data analysis. Read more here.
NEWER CUSTOMIZATIONS:
With version 5.2.3 couple of new charts customization options have been added which are briefed below.
(A) Filtering option at table header: From version 5.2.3, a new filtering option is added at table header level, as shown in the below image. This can allow end users to quickly filter out values. Click here to read about it.
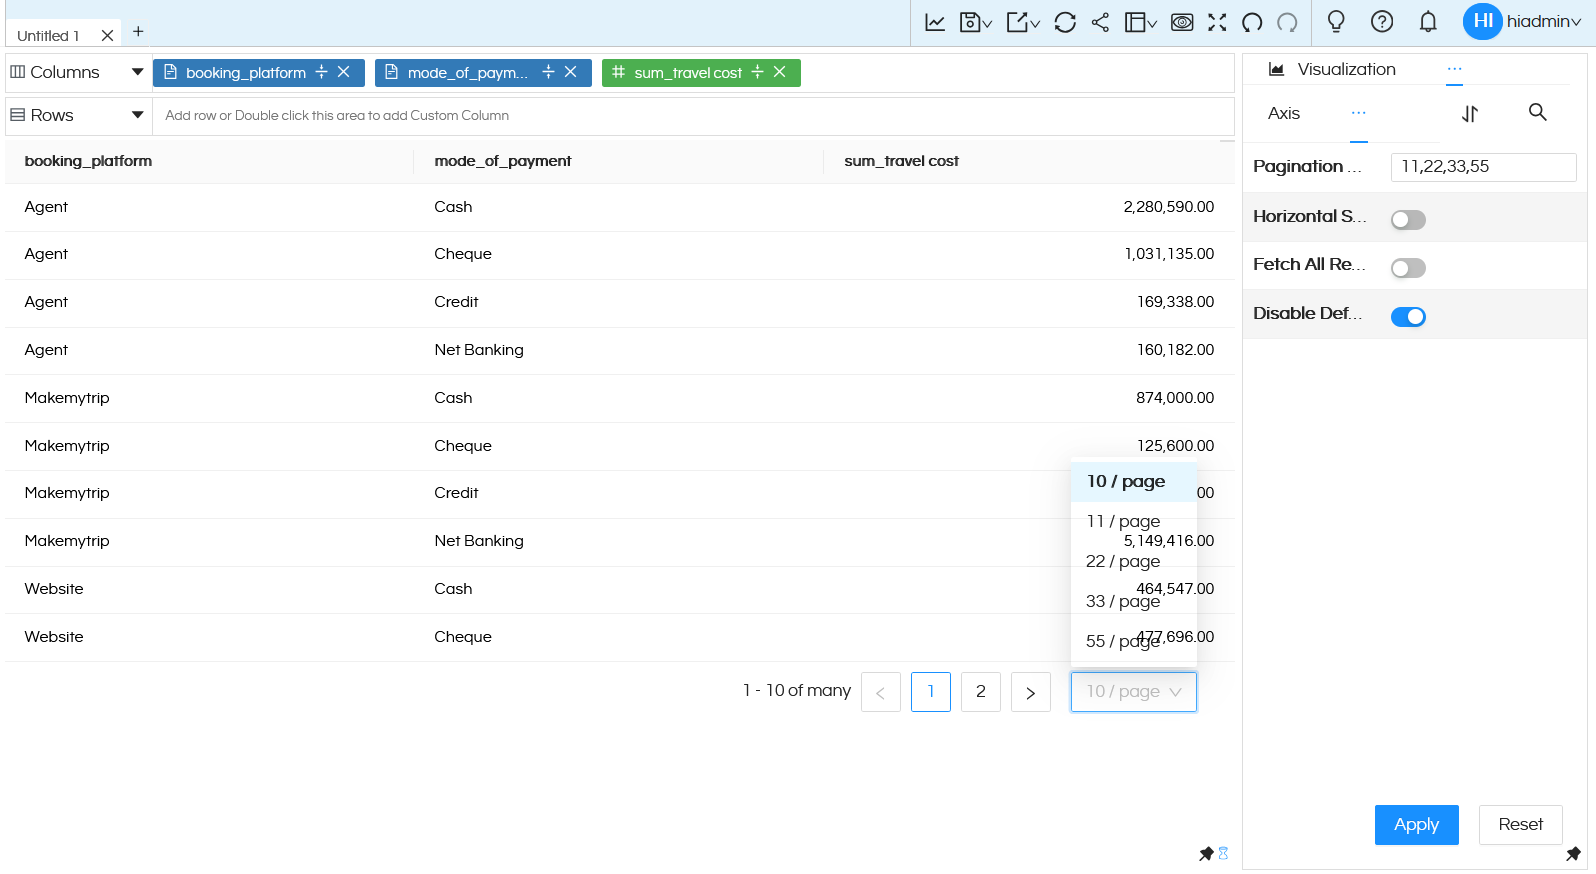
(B) Custom Pagination Options: Table reports comes with default pagination options like 5, 10, 20 and 50 per page. In certain cases when a user would not want to have certain kind of other pagination options and NOT use the current set of page records per page then we have introduced 2 new options. First option disables current pagination options. Further you can specify your options in comma separate values and use it.
(C) Multiple data labels: From version 5.2.3, we have introduced a functionality which can allow you to have separate data labels in case if you are creating a chart which has multiple measures or a combination chart. For each of those charts, you can specify which field is to be used as a data label for it. Read more here.
(D) Canvas Option: An all together new property is added called as Canvas. This canvas property can allow you to specify the position of the chart within the frame as well as size of the frame also. Click here to learn how to use canvas property.
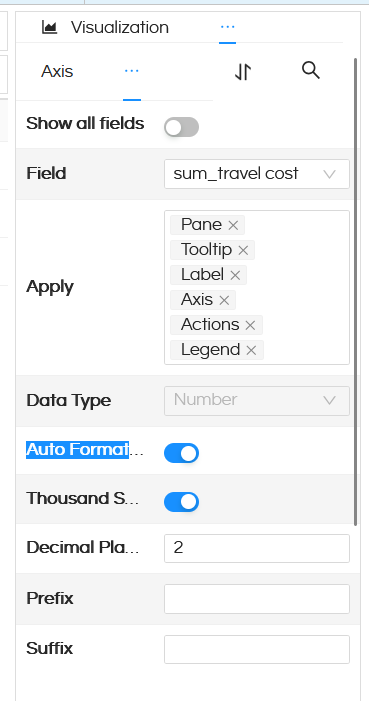
(F) Auto Formatting: In order to reduce the amount of efforts it takes to format a field, a new auto formatting is enabled. Based on the kind of field it automatically applies auto formatting like thousand separator, 2 decimal digits, alignment etc. If a user does not want to use such kind of autoformatting options, he can go to Formatting and set it as per his requirement. Read here to learn more.
(G) Space before: This property allows to put space when using formatting of numbers, thus improving the readability. Hence 234K becomes 234 K, 14M becomes 14 M. Read here to learn more.
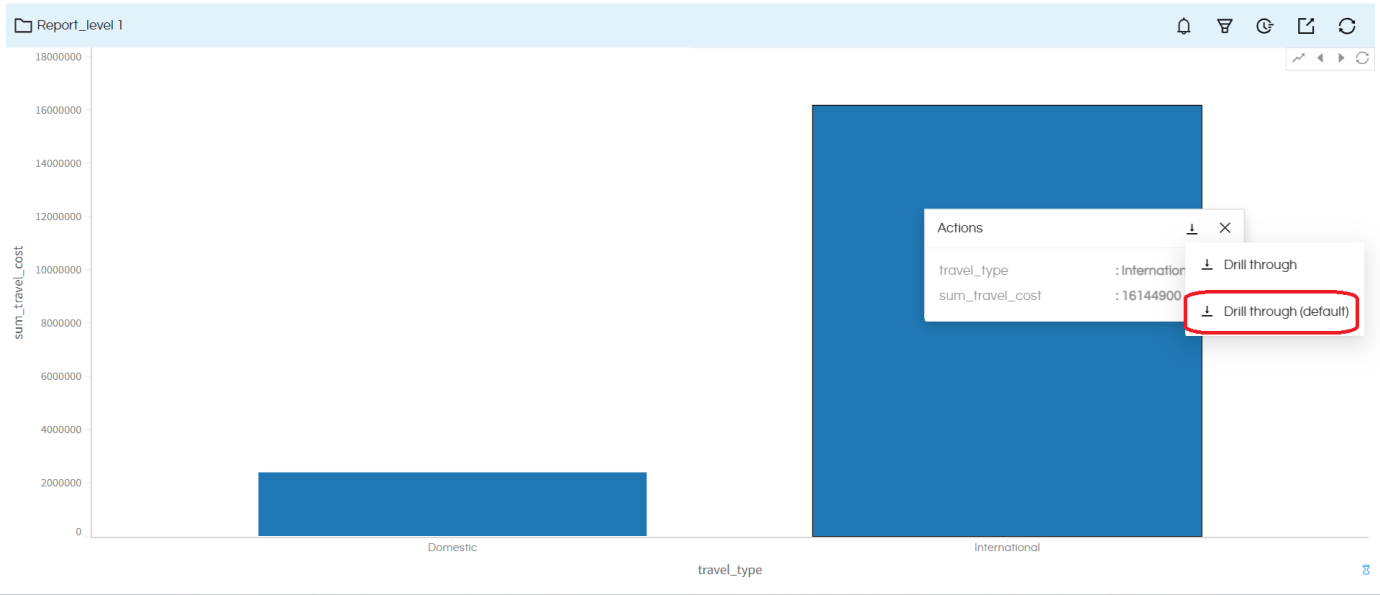
DRILL THROUGH:
Drill Through capabilities has been enhanced with addition of a new option. This option can allow you to open the child report/drill through with full data / default parameters. Click here to learn.
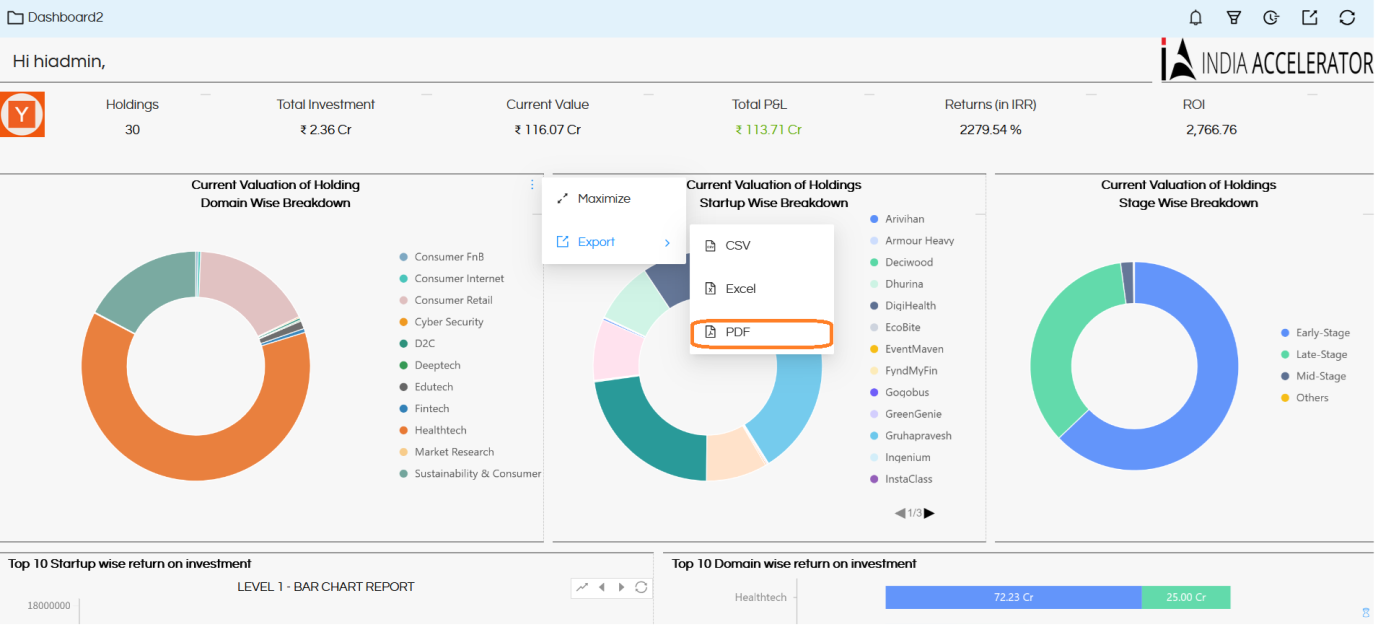
DASHBOARD DESIGNER:
(A) Export to PDF: Till now the entire dashboard can be exported into PDF, PPT and Image format. Whereas individual panels present in the dashboard can be exported into CSV and Excel format. However from version 5.2.3, individual panels of the dashboard can also be exported into PDF as well.
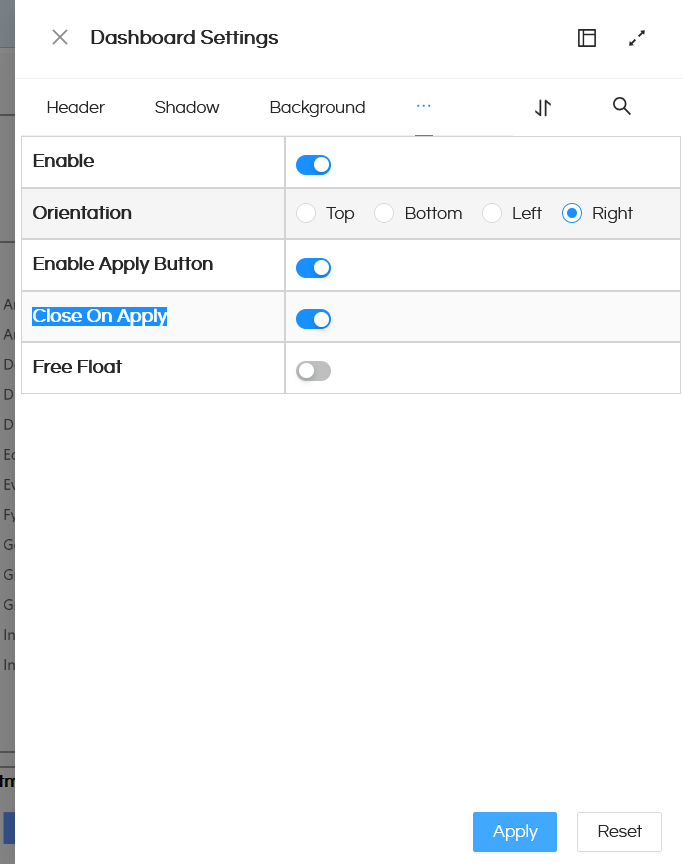
(B) Close on Apply: A new option is introduced which when enabled, it will ensure that when Apply button is clicked the filter popup closes.
BUG FIXING
Many of the known bugs have been fixed, some of the prominent ones are mentioned below:
- Apply before aggregate function not working
- Formatting of labels in map
- Axis tick angles
- Data type mismatch when using monthname db functions
- Formatting issue of labels in map visualization
Apart from the above, many other minor bugs have been fixed across various modules. Aside, with every release we continue to work on improving UI UX, improving the performance and security.
Please reach out on support@helicalinsight.com in case of any questions, POC, demo or further questions. Register and download for free from here.