From version 5.2.3 of Open Source BI product Helical Insight, a new property has been introduced called as Canvas. Canvas property can be used to specify the position of the created card/visualization in the frame. This is especially useful when we put a report into the dashboard and specify the size of that report container in the dashboard.
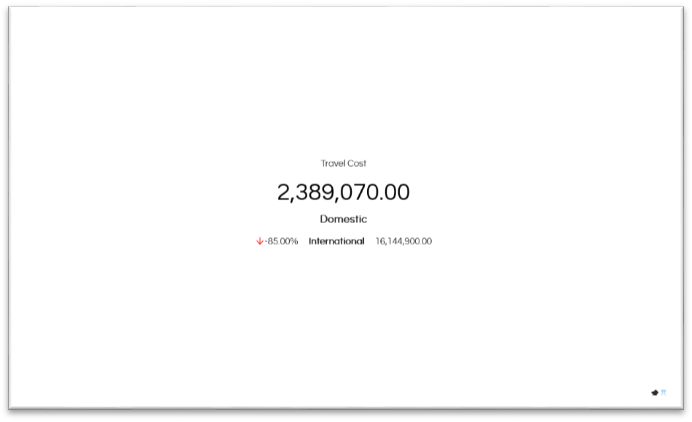
In this below blog we have shown how this Canvas property is affecting a trend card widget. The effect is similar when used with other kind of visualizations also. Right now you can see that the trend card widget is at the centre of the frame.
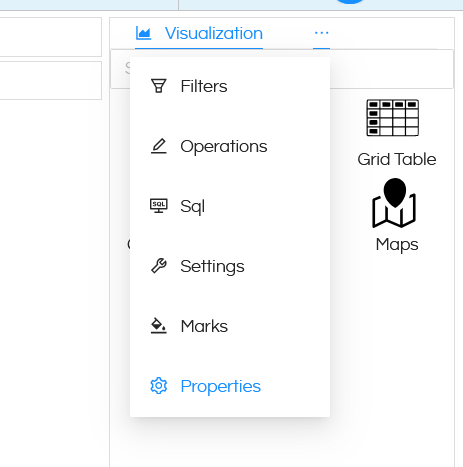
In order to use the Canvas property, click on Properties option next to Visualization.
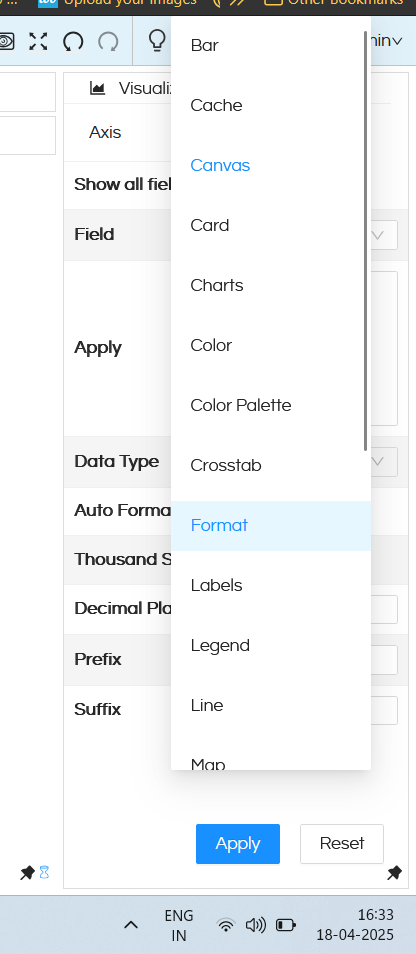
Then click on 3 dots next Axis and select the Canvas property option.
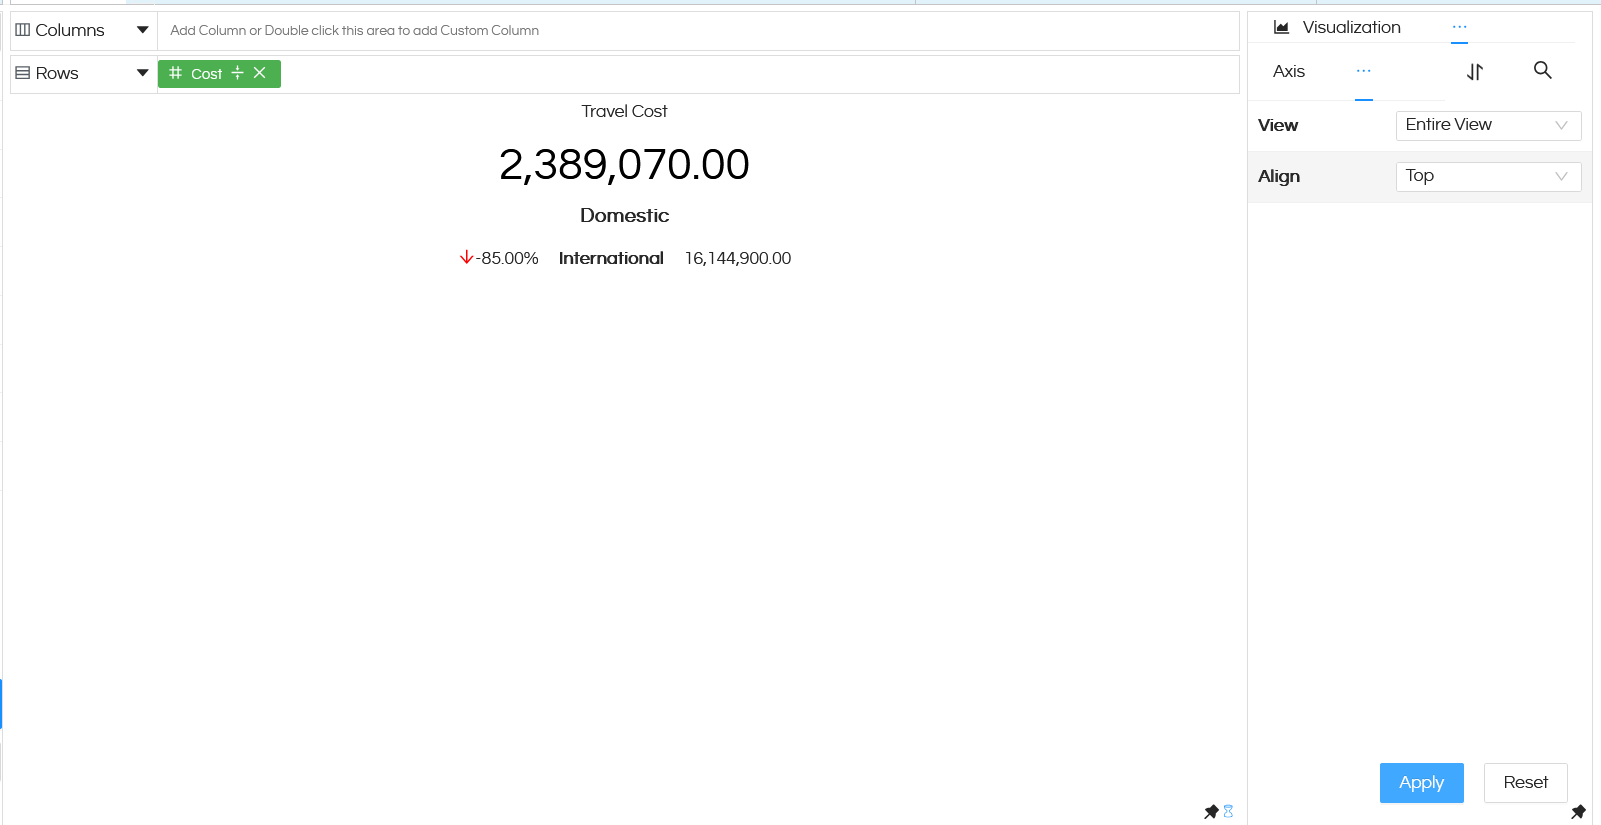
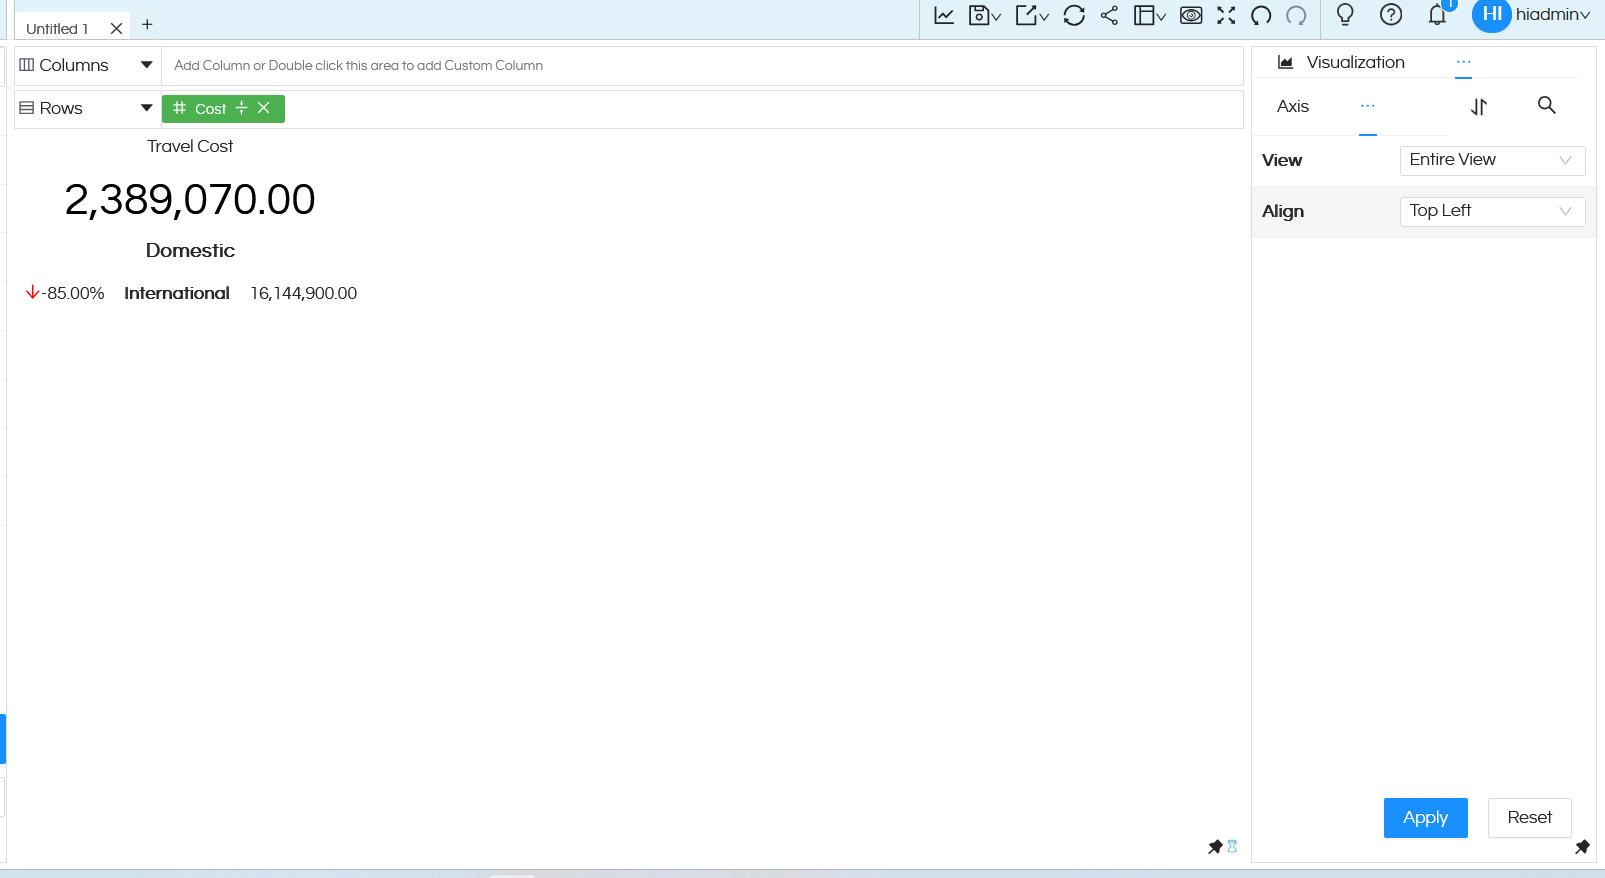
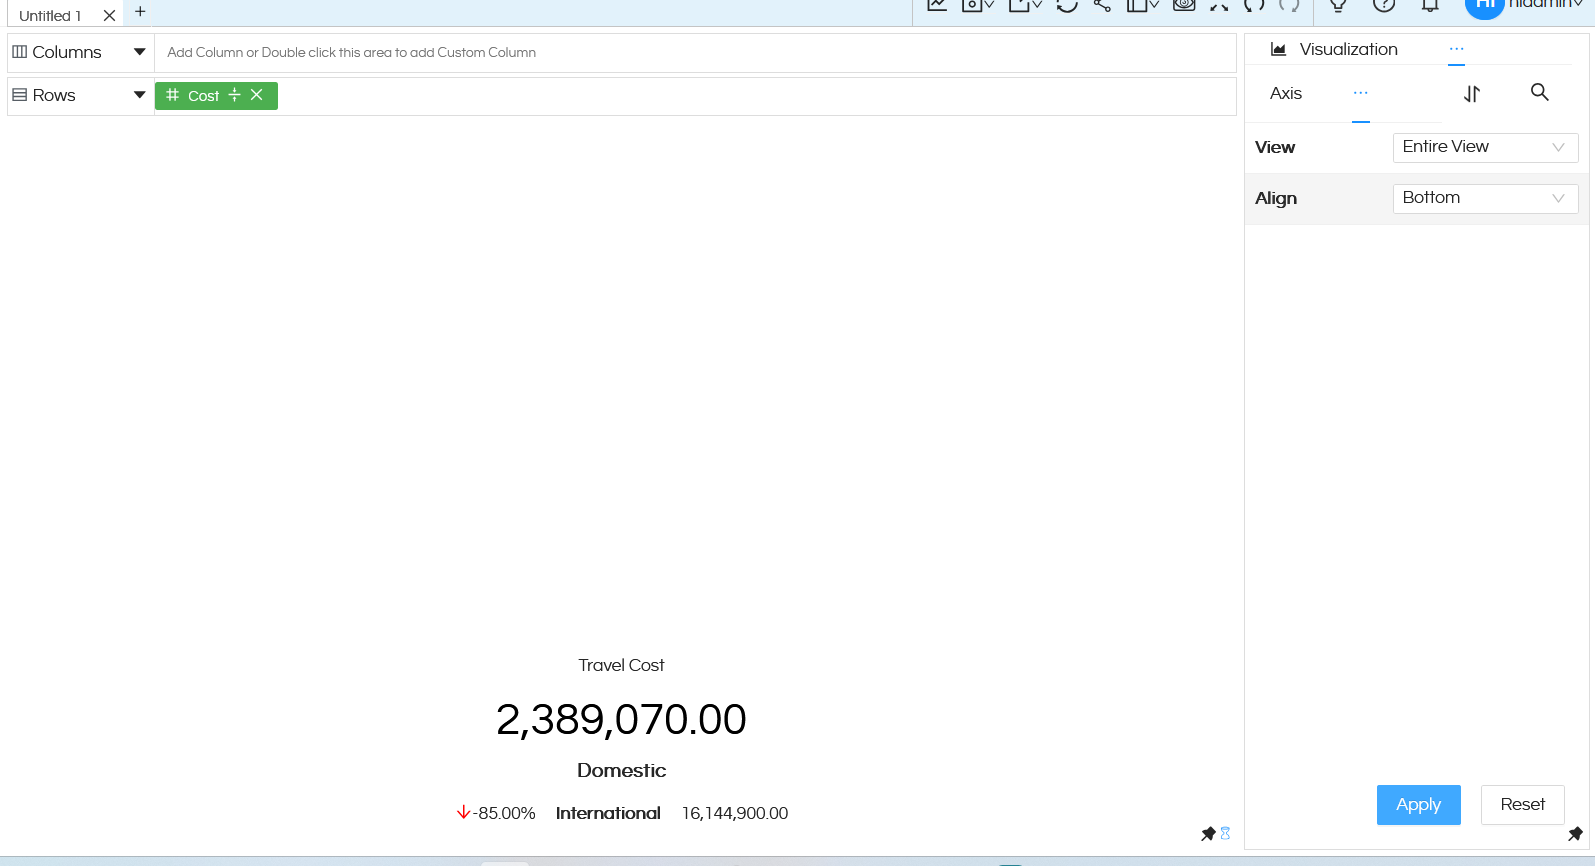
It will open an option like below. It has got two options. One for View and other for Align
View: View has got 4 options which include Entire, Fit Width, Fit Height and Standard.
- Entire View: With Standard, the visualization will be responsive and will try to fit and remain responsive within the frame size. This is most suited.
- Fit Width: Visualization will be responsive according to the width specified by user. User will also get an option to specify width manually.
- Fit Height: Visualization will be responsive according to the height specified. User will also get an option to specify height manually.
- Standard: In this case the user can specify both height and width. The chart will try to fit within the specified size.
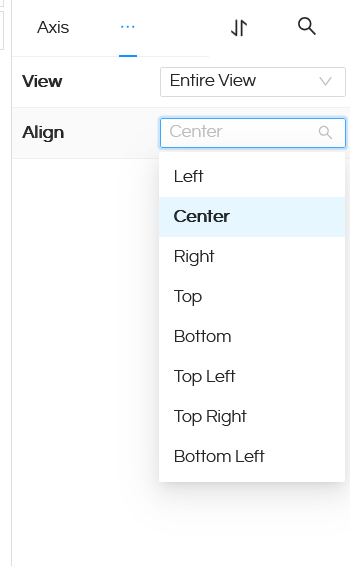
Align: This alignment option comes with options like Left, Right, Centre, Top, Bottom, Top Left, Top Right, Bottom Left, Bottom Right. Specifying the position will change the position of the visualization within the frame. Some examples are shown below. Centre is generally the most optimal one.