With version 5.0 of Helical Insight onwards we have introduced a different method of implementing drill down and drill through making the entire process much more smooth and simple to implement.
Note: Difference between Drill Down vs Drill Through.
In Drill Down, we go to a granular level of information within same chart. We can filter based on our selection but cannot change the selection fields or visualization. The drill down happens in the same chart and same visualization appears, same metadata customizations and other things are used. The current chart will be filtered based on selection. The benefit is that we need not to have another report prepared, we can quickly view the details as required.
In Drill Through, we have two different reports, with their own set of fields, customizations, metadata and visualization. We pass certain parameters from one report (known as parent report) on to the other report (known as child report). The benefit is that we can leverage the existing reports, with prepared fields and visualization and complete the task with different selection than expected.
Note: Drill Down and Drill Through can only be applied on Table, CrossTab and GridChart visualizations. The steps mentioned for implementing drill down or drill through though remains the same as explained below.
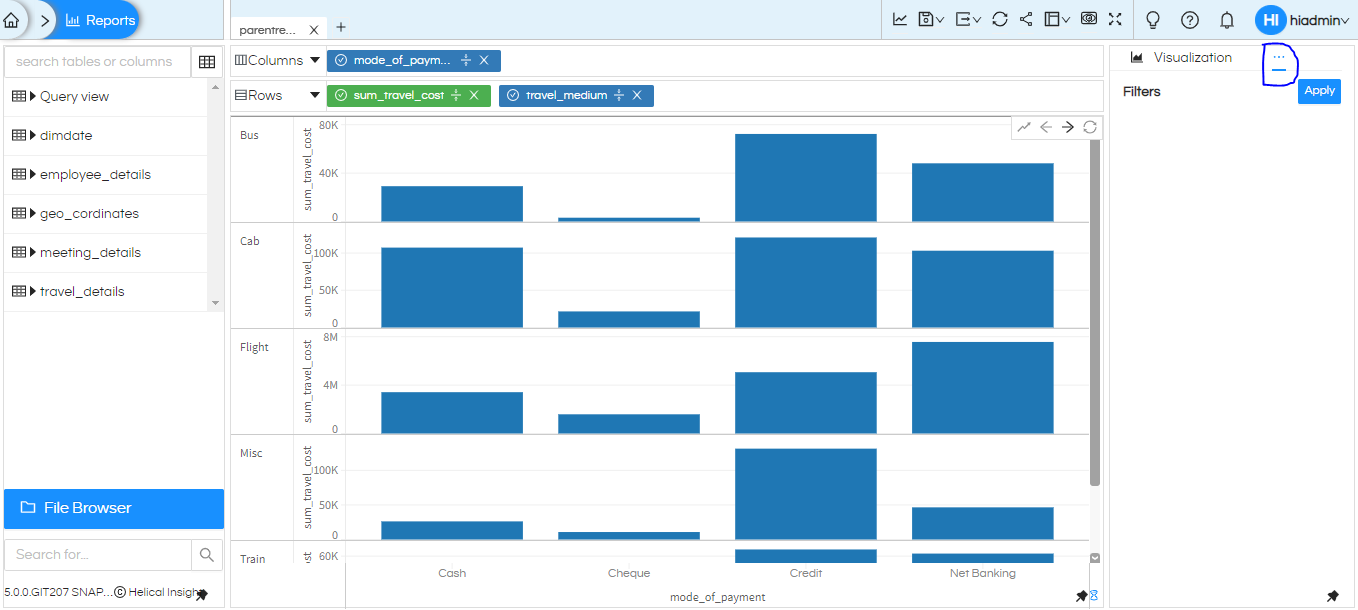
1. Create a report and click on meatball icon which is highlighted in the below snapshot
2. Click on “Marks” option, it will show “Interactivity”. When enabled, it will allow you to have either Drill Down option or drill through option. In this blog we are explaining drill down.
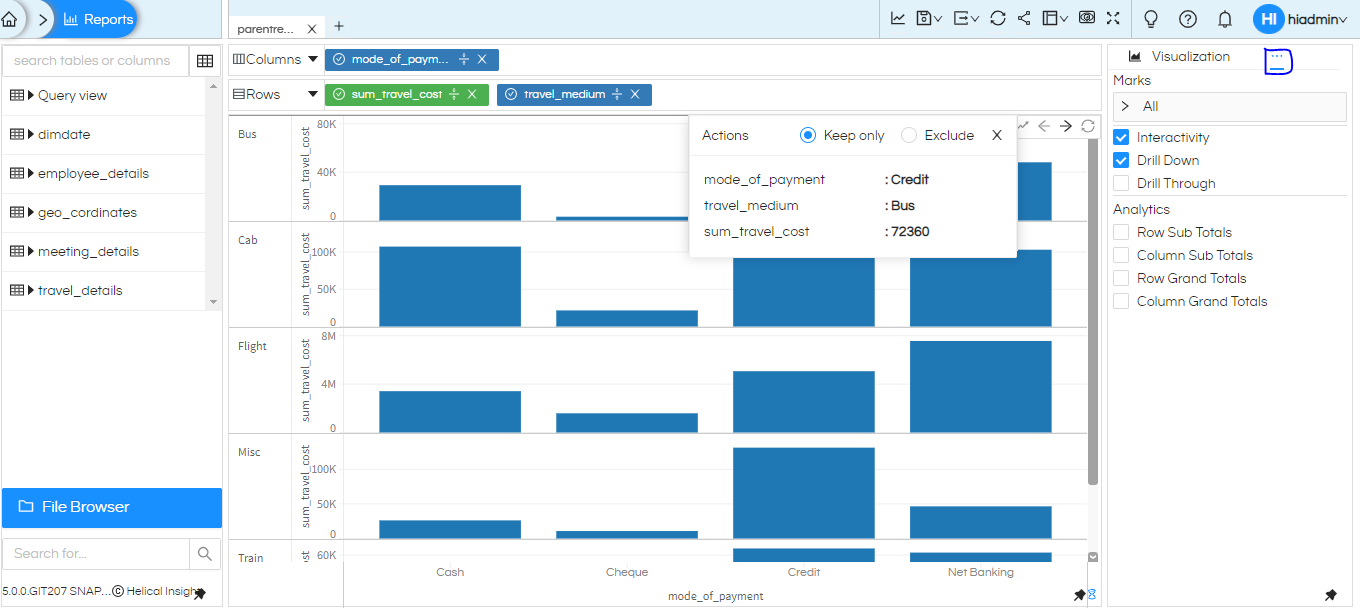
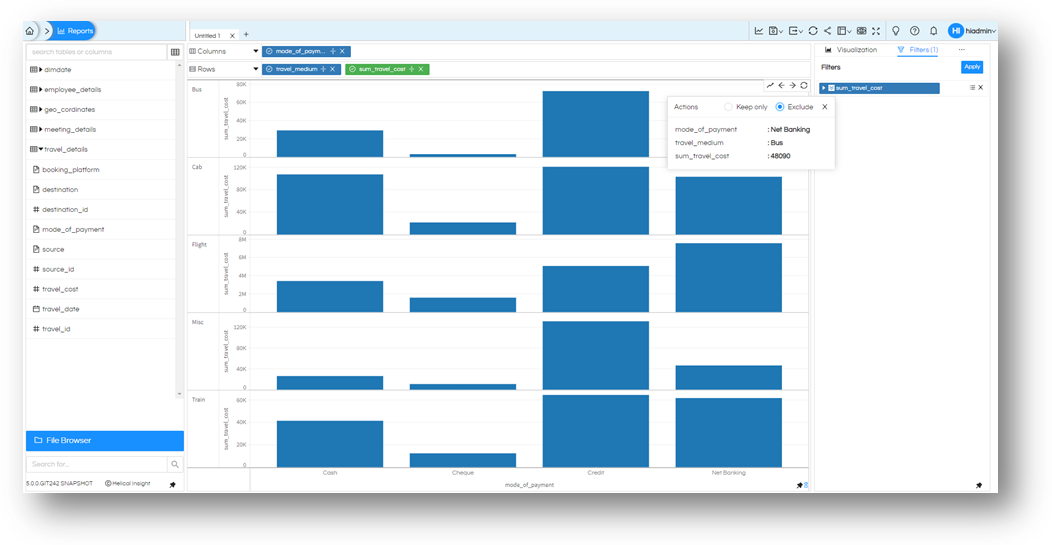
3. To check the drill down click on the bar, it displays below options
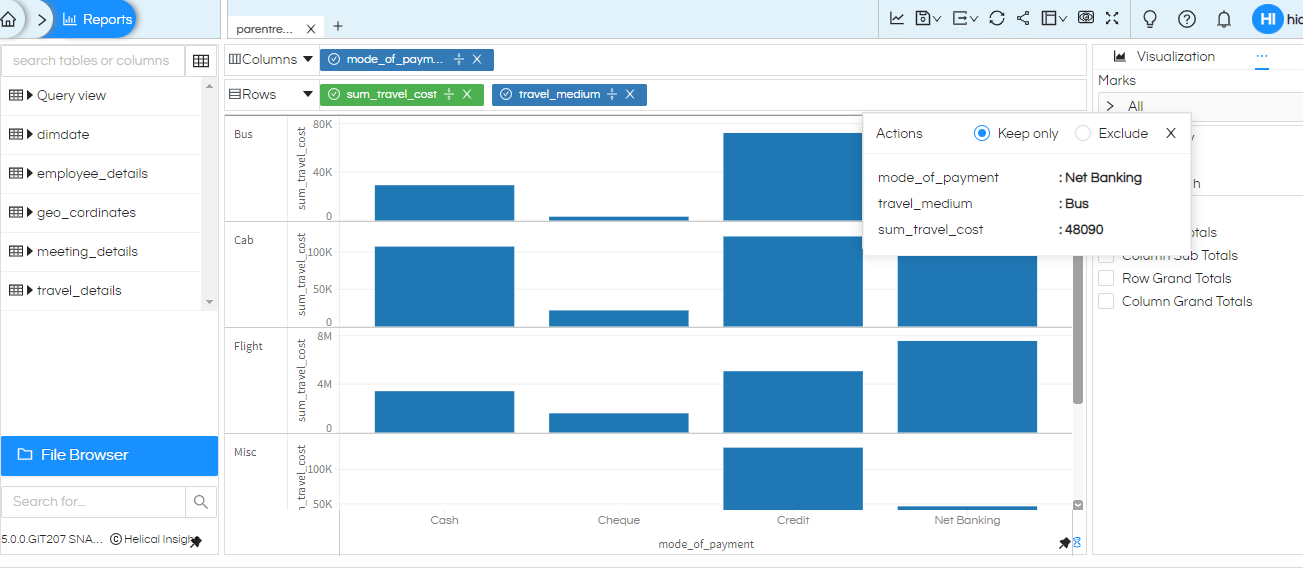
Passing on values to drill down
- Keep Only
- Exclude
When you click on a bar in the chart it will show you option of what all values are used to build this graph and from them you can select what all to pass when you drill down. You can keep only a single value, or multiple values, you can exclude certain values (negation of values). Let us select keep only and click on Net Banking.
You will notice that the filters are automatically added to your applied visualization as “Drill Down Filter” and the pane to the right is updated with the same. These are run time filters which are added temporarily and gets removed when the drill down has been viewed.
Further, note that it will drill down with selected value as Net Banking in the filter and the resulted graph generated is specifically to the selected value.
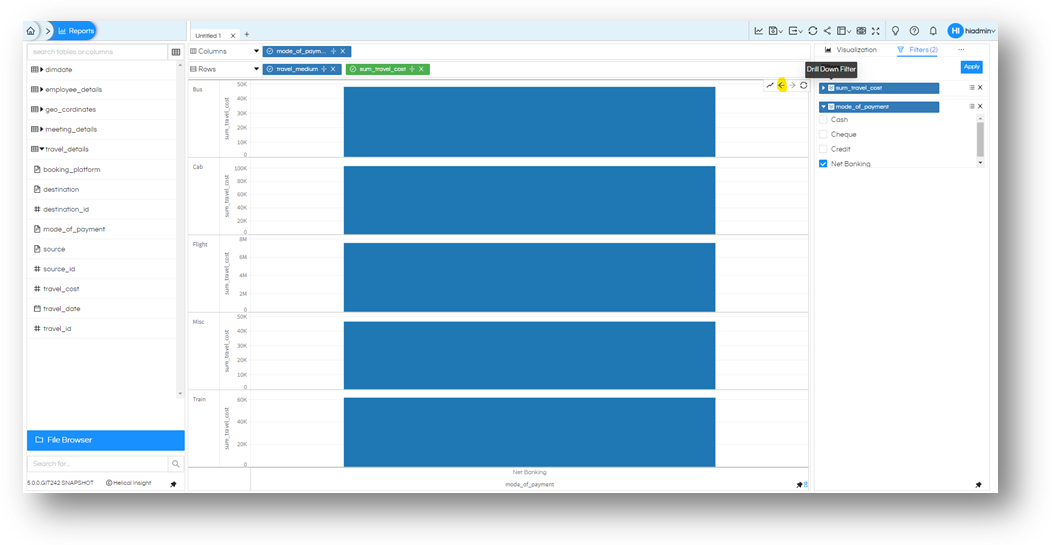
Now let’s repeat the process by selecting Exclude, to go back let us select the left arrow button which is added on top right of the chart as highlighted above. Once you are on parent report, click on the same bar again. This time let us select “Exclude” and select Net Banking.
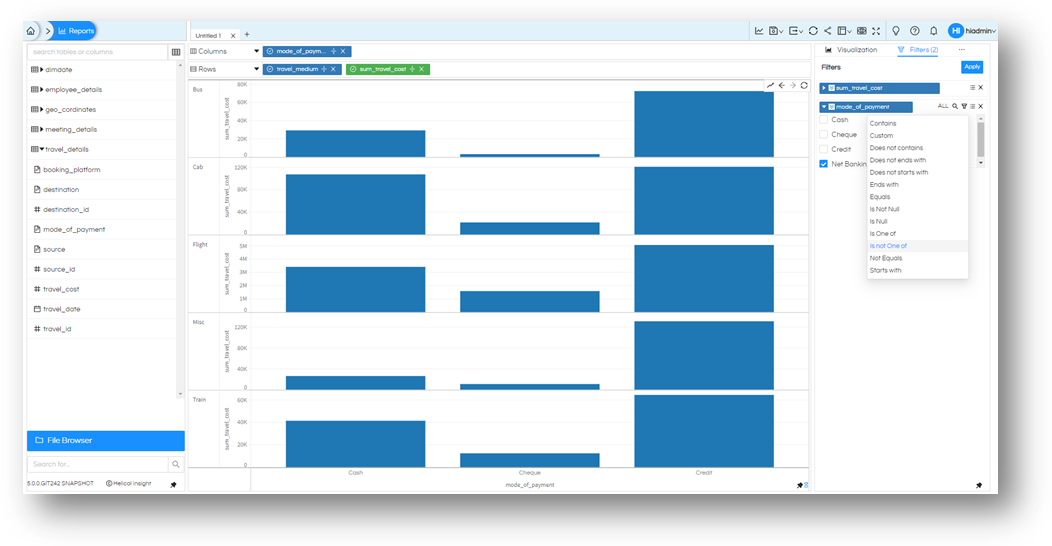
This time you will notice that the report is generated on all the values except Net Banking. With Net Banking still selected in filters. If you go ahead and see the filtering condition, you will notice that it is now set to Is not One of. Thereby, sharing every other value except this one.
Selecting multiple values
Sometimes it is not only one value that is under consideration, we may have to look into more than one value. Let us go back to parent report one more time with back button on the top right of the chart. This time we want to select first bar of Cash, and the third bar Credit from mode of payment.
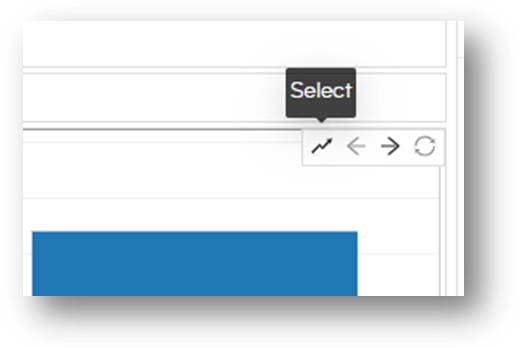
On the top right we have a select button (right near to left button we used to navigate to parent and child report). This button enables a lasso select on the graph.
Now let us start with space on left of first bar, click and start dragging around, make sure that our pointer crosses first bar, skips the second bar and reach the third bar. Let us complete the lasso by coming back to starting position. You can make any random movement, as long as it serves the purpose. That is, selecting the first and third, but not the second. Everything inside this figure or touching by this figure will be selected.
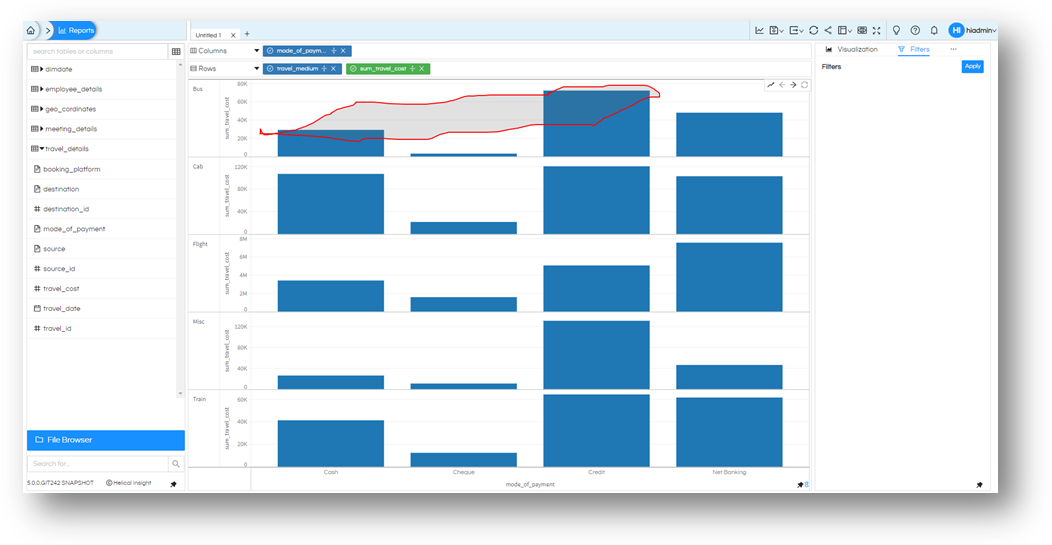
As soon as you complete the figure, you will notice that the popup this time includes the two values we wanted, i.e. Cash and credit.
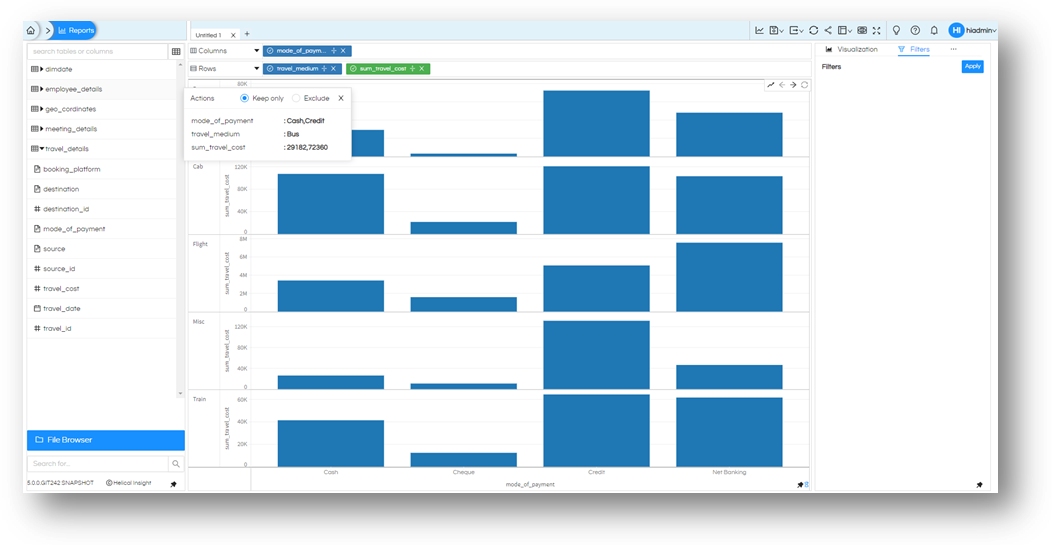
Rest is the same process; you can choose to “Keep Only” or “Exclude” based on your needs. Let us select “Keep Only” and proceed for now to see the drill down report.
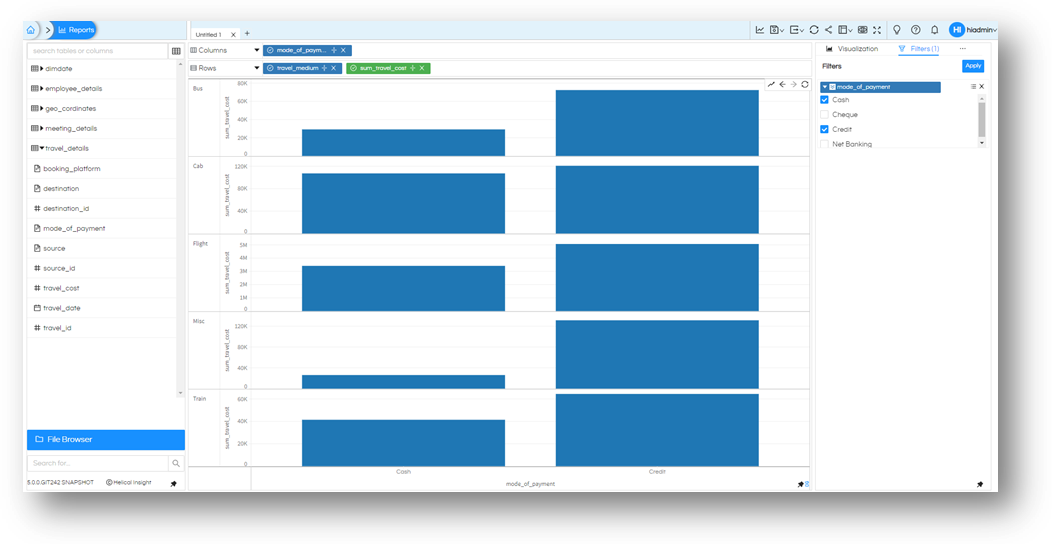
Before we end: Let us understand that the Lasso selection tool is applied only on one of the graph. In above example, we have 5 different travel_medium in 5 different graphs, you can choose to apply lasso on any one of them, but you may not be able to select two graphs and add up to selection. Position of rows columns and values controls how many charts are getting generated.
Thank You,
Helical Insight
