NOTE: From version 5.2.2, additional options of Drill Through with limited data (based on the on-click event) or full data with default values is introduced. The same is covered towards the end of the blog.
In this document we will be covering how to create a drill through report. Refer to our other blog to learn how to implement drill down in helical insight version 5.0
Note: Difference between Drill Down vs Drill Through.
Note: Drill Down and Drill Through can only be applied on Table, CrossTab and GridChart visualizations. The steps mentioned for implementing drill down or drill through though remains the same as explained below.
In drilldown, we go to a granular level of information within same chart. We can filter based on our selection but cannot change the selection fields, metadata, filters or visualization. The current chart will be filtered based on selection. The benefit is that we need not to have another report prepared, we can quickly view the details as required.
In Drill through, we have two different reports, with their own set of fields and visualization. We pass certain parameters from one report (known as parent report) on to the other report (known as child report). The benefit is that we can leverage the existing reports, with prepared fields and visualization and complete the task with different selection than expected.
Let us start by having two reports for this.
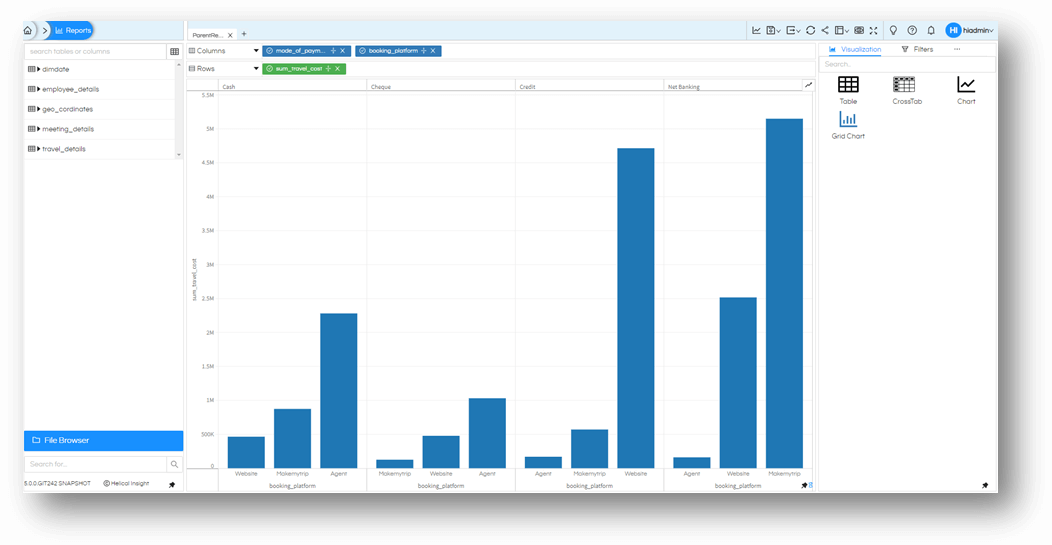
Parent report: Created with 2 dimensions and 1 measure as shown below.
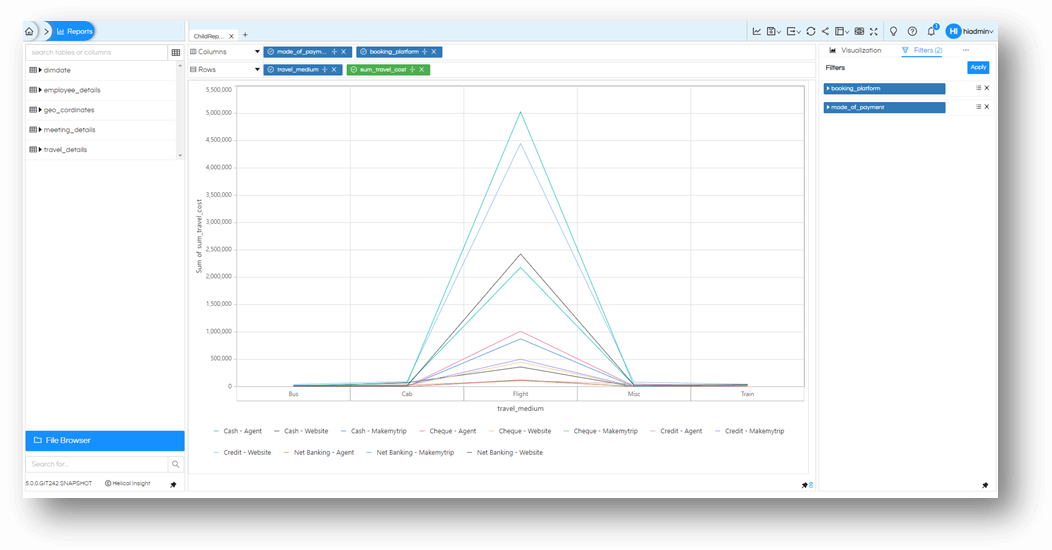
Child report
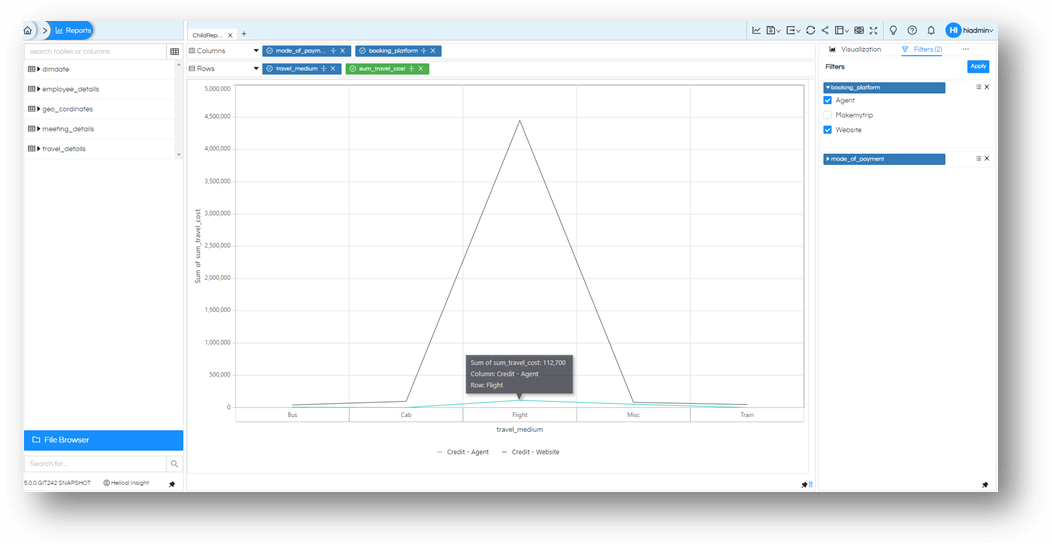
This report will have two filters mode_of_payment and booking_platform that we expect to be coming from parent report selection.
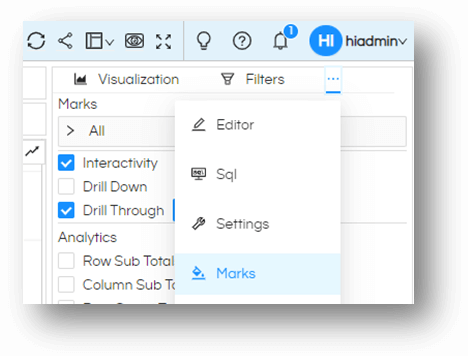
Enable Drill Through
On parent report click on meatball icon which is encircled in the below snapshot. Click on “Marks” menu, enable Interactivity. It will show Drill Through option. Enable the option by checking the box alongside it. Image below will guide you.
Select the Reports button next to Drill Through. This will open a File Browser. Select the child report which will receive information when we click on this parent report.
Once you have selected that, you will see the filters from Child Report listed below the Drill Through option
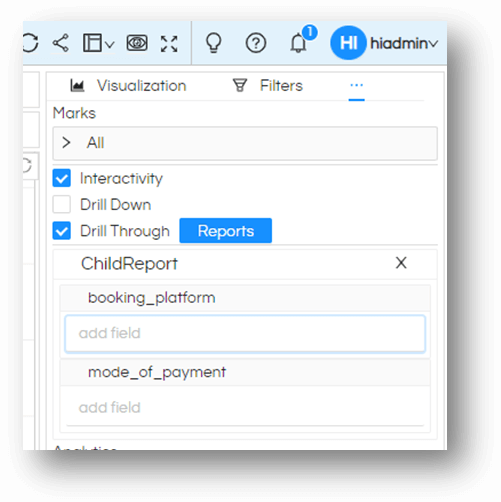
Drag the field by from the metadata field into this area, hence mapping the parameters that you want to pass along to the child report filters.
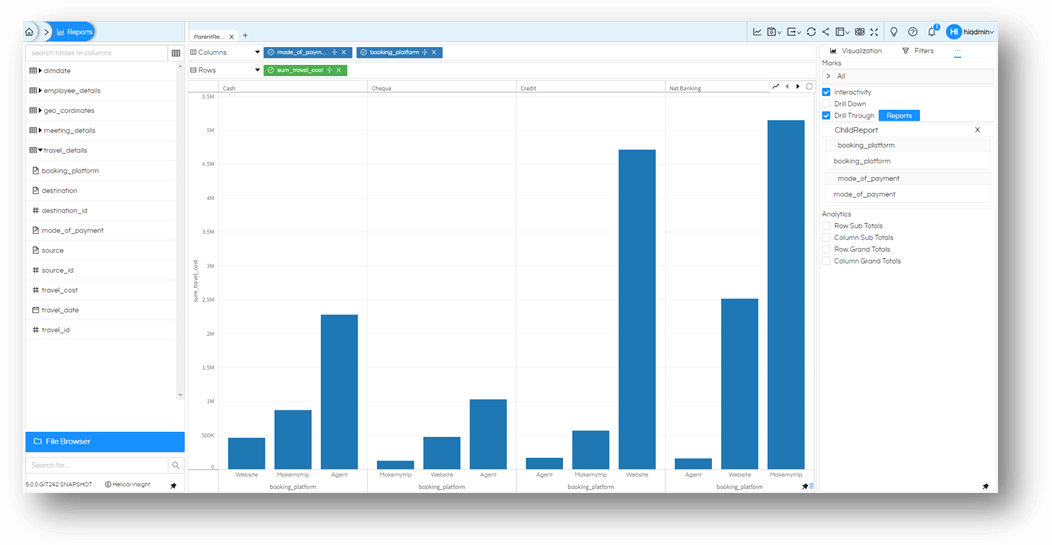
Our Drill through functionality is ready to be used.
Single Select Values
Now in the parent chart let us click on any of the bar and see what values are passed to child report and how the child graph is filtered and rendered.
Let us click on a bar and you will notice the first difference in the popup. You will now have an Action popup option with option to Drill Through (or close the popup).
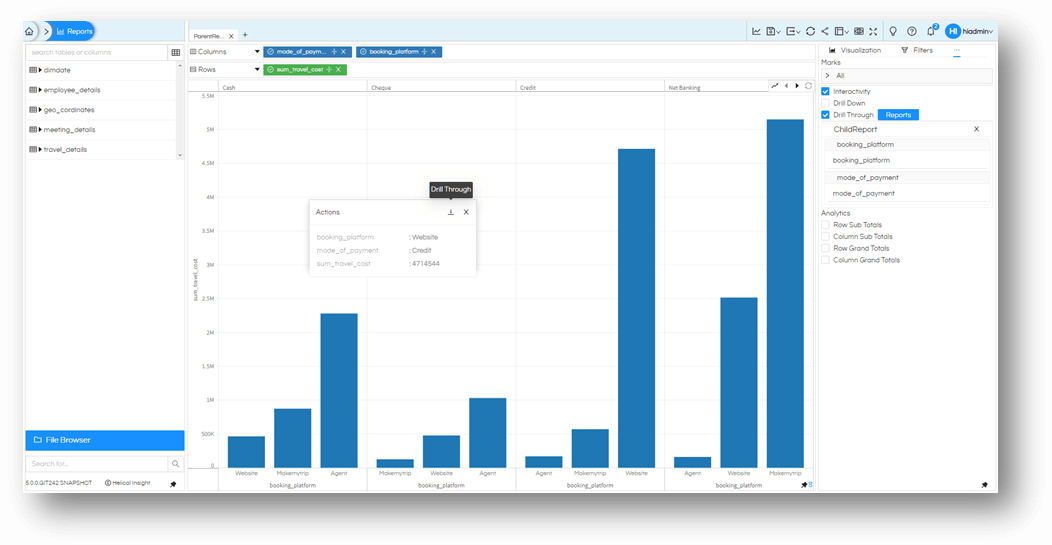
Let us click on Drill Through option and see what happens.
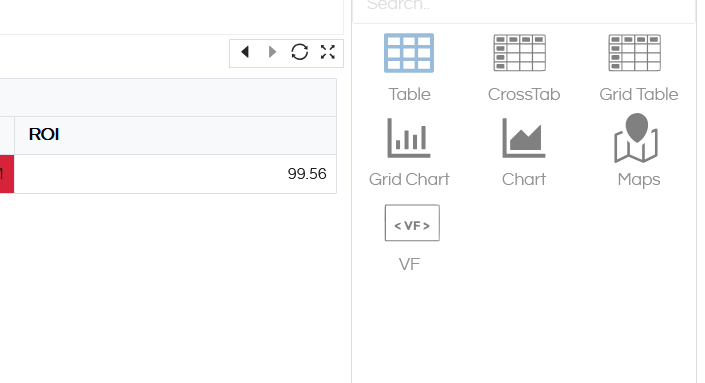
It will open up the child report in the same frame.
When a drill down has happened, at the top right we can see an options like “Drill Through Previous”, “Drill Through Next”, “Refresh” allowing users to navigate to previous report, next report or refresh and open the first report.
Maximize button which is the fourth option allows the child report to open as a popup for easier viewing. It can then be closed as well.
This is useful in cases wherein we want to see the child report in bigger screen size. Then it can again be minimized.
All these drill through functionalities when enabled at the report level can also be used in dashboard mode also.

Multi-Select Bars
Before using the multi select option we need to be sure that in our child report the filtering condition is set to accept multiple values like “is one of”, “is not one of” etc otherwise it will give SQL error. In Parent report you will have option to “select” on top right of the chart as shown in the image below.
Select it to enable a multi-select lasso tool on the current chart.
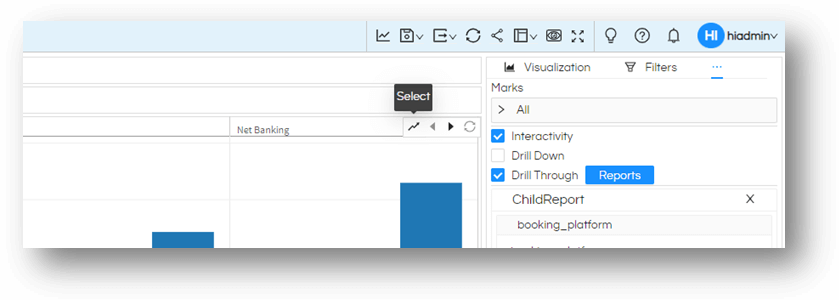
Select the values you want to select and pass along. Let us select booking_platform as Agent and Website for mode_of_payment as Credit as shown in image below. Everything that the lasso touches will be part of selection, be cautious that you keep it away from the unwanted values.
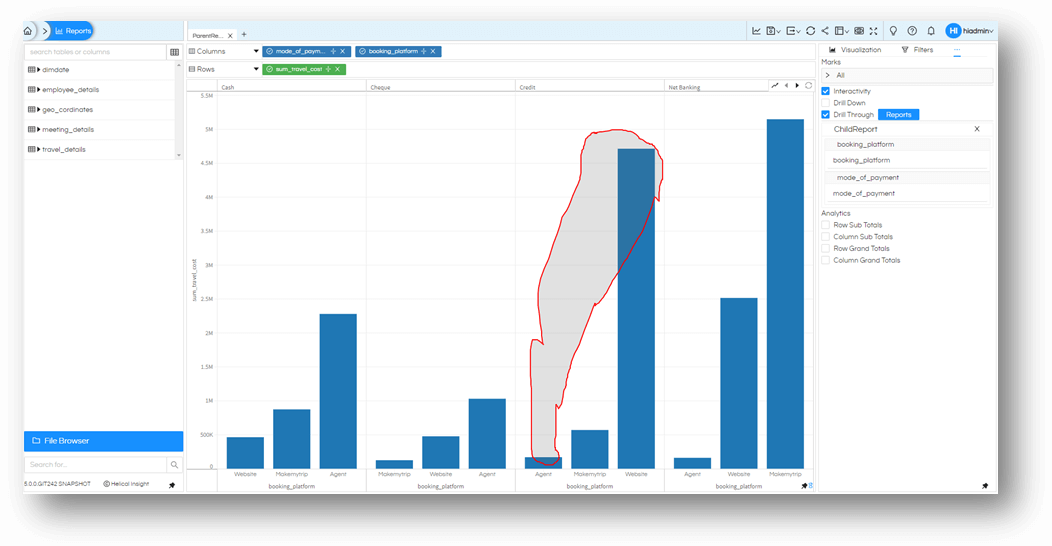
As soon as you complete the selection you will see that popup now has multiple values based on selection
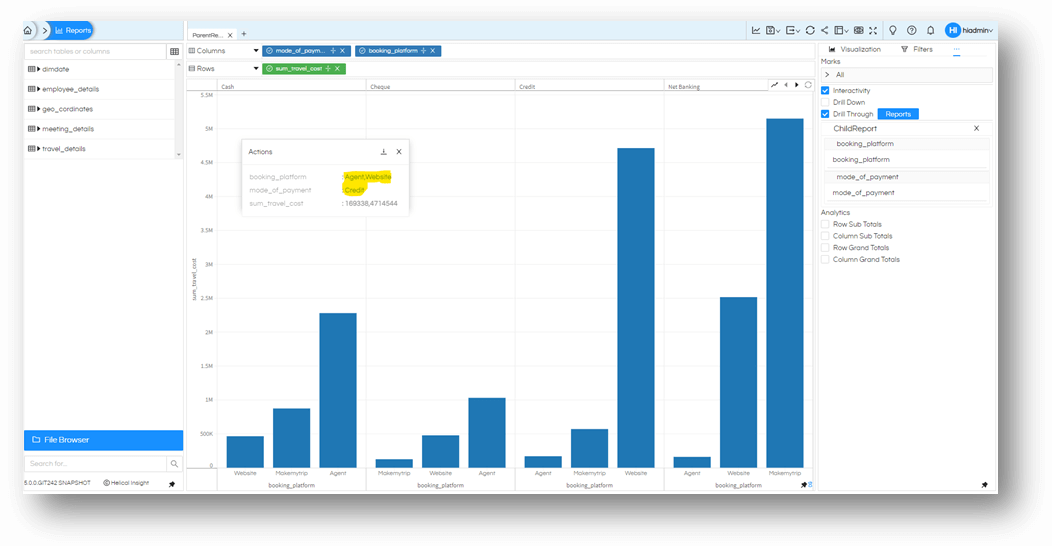
Click on Drill Through to pass these values to child report and render it.
Note: The Lasso selection tool that we just used is applied only on one of the graph. In above example, we have 4 different charts in parent report, one chat for each of the mode_of_payment, you can choose to apply lasso on any one of them and select as many values inside this chart, but you may not be able to select two graphs and add up to selection. Position of rows columns and values controls how many charts are getting generated.
Like the drill through is implemented on chart, in a similar way drill through can also be implemented on a table as well as crosstab visualization, however multiselect (using lasso) is not possible in table and crosstab charts. In a Table or CrossTab, you can click on any value to pass on to child report.
Starting from Helical Insight version 5.2.2, clicking on Drill Through will show two options.
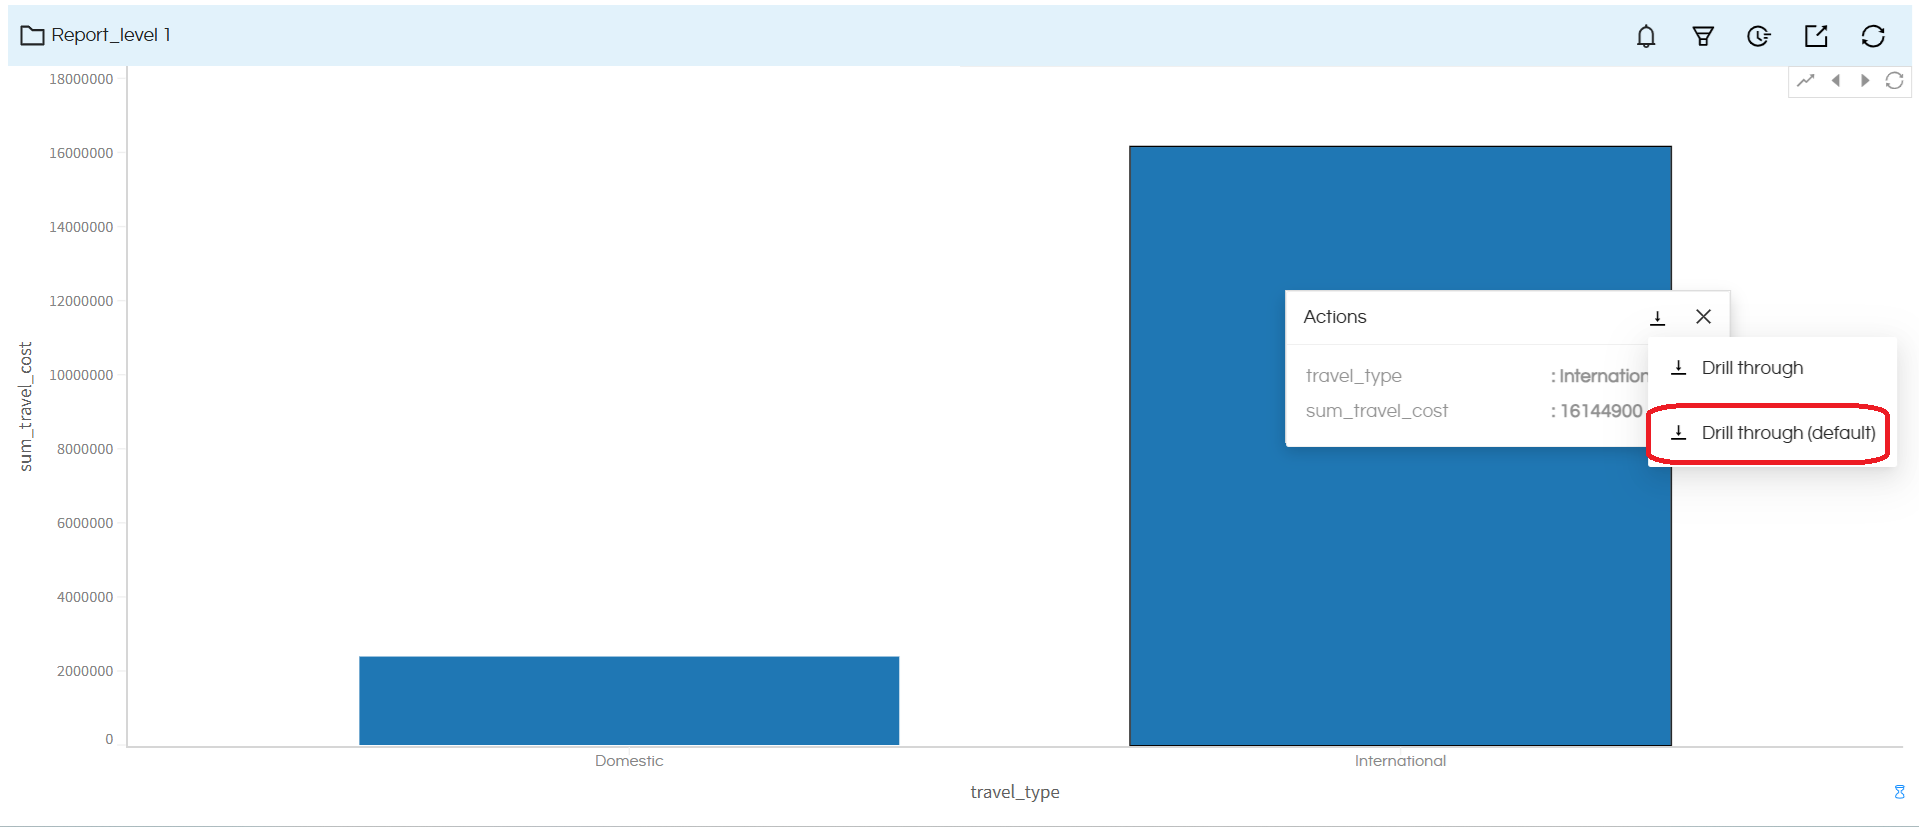
– Drill Through: First option Drill Through will open the Drill Through child report with filtered out data based on the onclick event which you have done and the values which got passed from this on-click action.
– Drill Through (Default): When this option is used, it will open the Drill Through child report with all the default values while configuring the drill through. If you have passed some hard coded values, those will get passed.
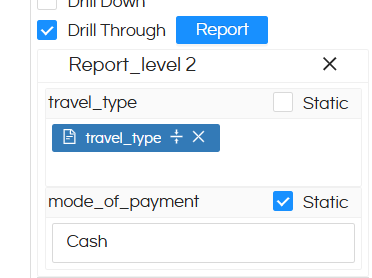
Example: If you refer to the below snapshot, the drill through child report has 2 filters, one is configured and the other second filter has static value being passed. Hence, when the Drill Through (Default) option is used, the child report will open with all data for travel_type filter and Cash for mode_of_payment filter.
Thank You,
Helical Insight
