This blog will help you in creating and deploying the TreeMap Chart using VF in Helical Insight Application. We can deploy and use TreeMap with drill-down capabilities using the VF method of visualization in Helical Insight
- Extract the TreeMap.zip. It contains two files TreeMap.efwvf file and treemap_styles.css
- Create a folder in the below path at your server from the backend (not via browser):
- Open the Helical Insight application from the web browser
- Navigate to Ad-hoc interface and select the required metadata
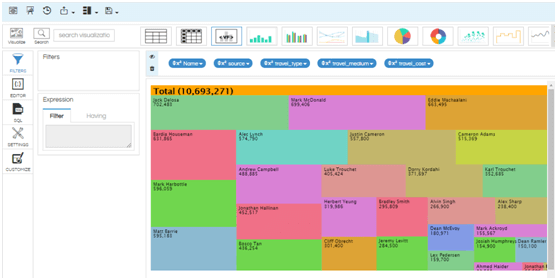
- In the this chart selected dimensions: name,source,travel_type,travel_medium and measure : travel_cost
- See the below screenshot (report creation)
- After selecting columns click on
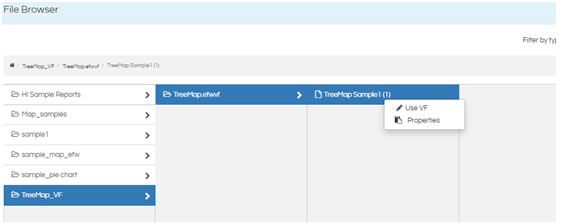
from list of charts icons - Choose the path of VF ( the file where you placed the EFWVF file) (see screenshot)
- Right click on the file and select use VF
- The chart will be generated as shown below
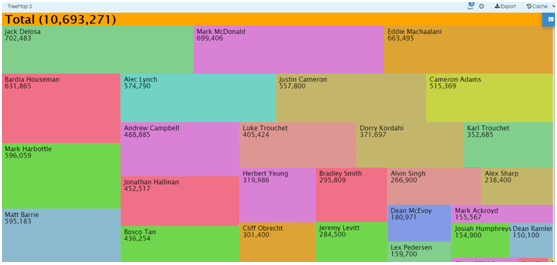
- Save the report and open in new window(see the screenshot)
(ex: TreeMap_Sample)
“...\Helical Insight\hi\hi-repository\TreeMap_VF”.
For example, the path in my case is “C:\Program Files\Helical Insight\hi\hi-repository\TreeMap_VF”and copy both files into the created folder
To create a TreeMap chart you need to select hierarchy levels data
Note: (You need to select columns which are dimensions (1,2,3,4..etc) along with only 1 measure (measure should be at the end)


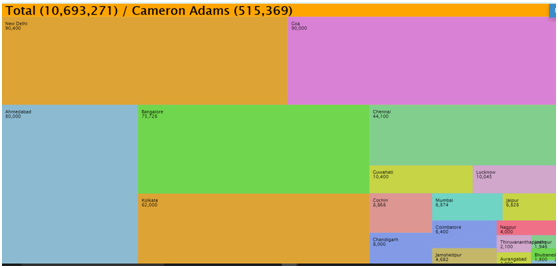
Second level hierarchy:

Note: Top level hierarchy is visible when the report is opened if we click on squares we can see next level hierarchies data and in the header part it displays Total value.
In Case if you have any queries please get us at support@helicalinsight.com
Thank You
