In this blog, we shall see learn how to create a grouped bar chart in Helical Insight enterprise version 3.1.
Grouped bar charts require two dimensions and one measure. The current grouped bar chart does not have more than two levels of grouping at the X-axis level.
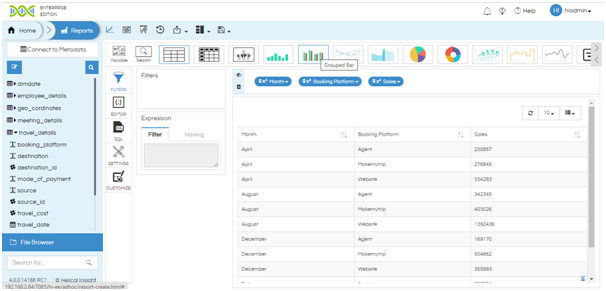
First you can create a tabular report with two dimensions and one measure. It will look something like below

Click on the Grouped Bar Chart icon in the visualization ribbon.

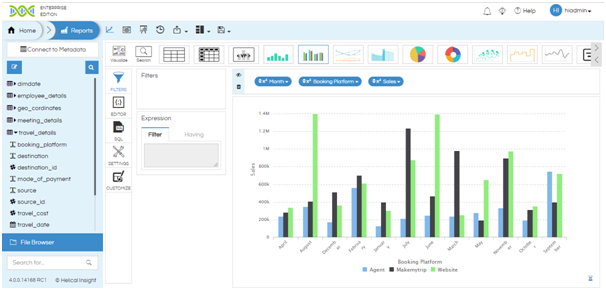
The grouped bar chart is created. Please note that the first dimension will be taken as the axis and the second dimension will be shown as a group in bars. You can interchange the position of the columns to change which dimension will be shown on the axis.

Currently, multi-dimensional grouped bar charts are not supported by default in Helical Insight.
