Introduction:
In many cases we would like to display the filters values which have been selected at a specific place. So in this blog we would describe how that can be done.
Concept: Via dashboard.getVariables(NameOfFilterVariable) we can get the values of the selected filters. Fo what we can do is we can create some HTML containers in which we render these dashboard variables.
Steps to be followed :
- Create a report with filters( filters may be single or multi select)
- Add the report into the dashboard
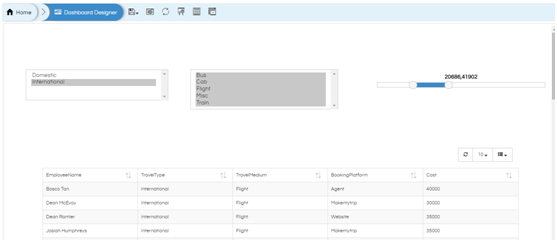
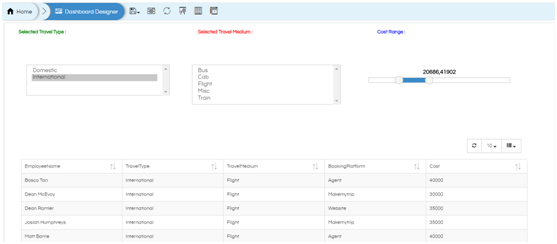
- For this specific example we have created the dashboard and aligned the filters and report as shown below :
- After that align the filters and report as shown below :
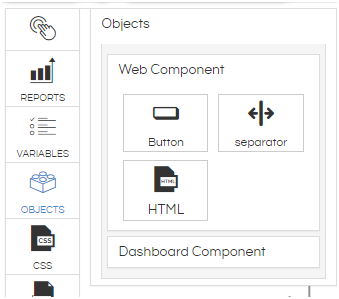
- Create html component by going to Objects -> HTML in the toolbar and align at the top position of the dashboard.
- Provide the below html code (i.e. creating 3 divs for displaying the values of 3 filters):
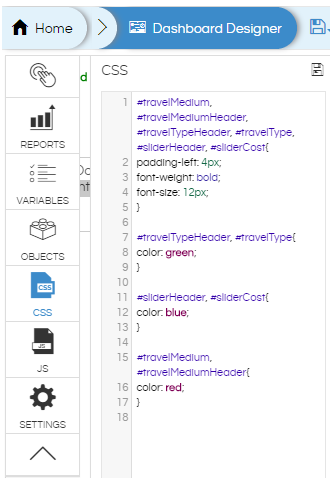
- Provide the below css in the css place holder (optional: to change the look and feel of the header of those divs) :
- After providing the html ,css the report edit view will be as show below :
- The final step is to display selected filter values dynamically in the respective divs of html code. For that we need to create custom component to set the selected filter values
- Save the report
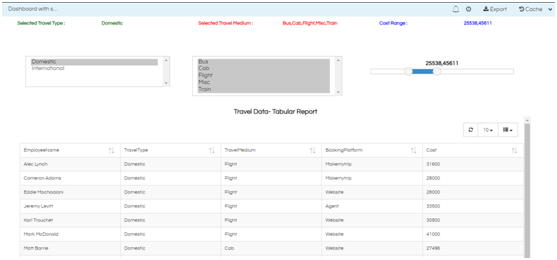
- Report view with open in new window
<div class="col-xs-12 col-md-12 col-sm-8">
<div class="col-sm-4 col-md-4 cols-xs-8">
<div class="col-sm-6 col-md-6 col-xs-8" id="travelTypeHeader">Selected Travel Type :</div>
<div class="col-sm-6 col-md-6 col-xs-1" id="travelType"></div>
</div>
<div class="col-sm-4 col-md-4 cols-xs-12">
<div class="col-sm-6 col-md-6 col-xs-12" id="travelMediumHeader">Selected Travel Medium :</div>
<div class="col-sm-6 col-md-6 col-xs-12" id="travelMedium"></div>
</div>

<div class="col-sm-4 col-md-4 cols-xs-12">
<div class="col-sm-6 col-md-6 col-xs-12" id="sliderHeader">Cost Range  :</div>
<div class="col-sm-6 col-md-6 col-xs-12" id="sliderCost"></div>
<div>
<div>
CSS :
#travelMedium, #travelMediumHeader, #travelTypeHeader, #travelType, #sliderHeader, #sliderCost{
padding-left: 4px;
font-weight: bold;
font-size: 12px;
}

#travelTypeHeader, #travelType{
color: green;
}

#sliderHeader, #sliderCost{
color: blue;
}

#travelMedium, #travelMediumHeader{
color: red;
}
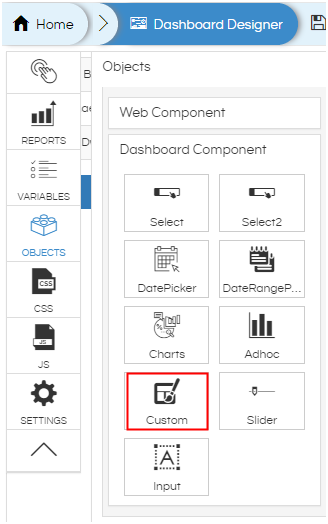
Click on the “custom” and provide the listeners and js script as shown below. I have filters like TravelType and TravelMedium etc. So in the dashboard.getVariable(TravelType) etc is coming. You can find out the name of the filter by clicking on “VARIABLES”:
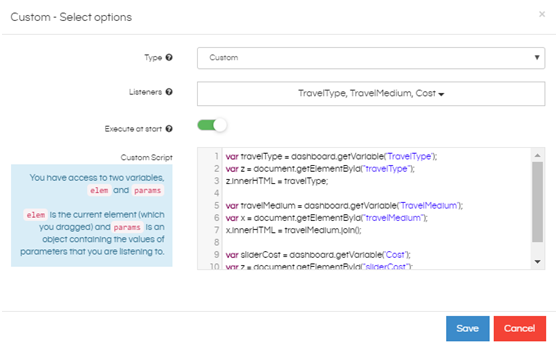
Custom Script :
var travelType = dashboard.getVariable('TravelType');
var z = document.getElementById("travelType");
z.innerHTML = travelType;

var travelMedium = dashboard.getVariable('TravelMedium');
var x = document.getElementById("travelMedium");
x.innerHTML = travelMedium.join();

var sliderCost = dashboard.getVariable('Cost');
var z = document.getElementById("sliderCost");
z.innerHTML = sliderCost;
Click on save after providing the custom script as well as align the custom script component at the bottom of the dashboard.
Note : This component will not appear in the report open mode
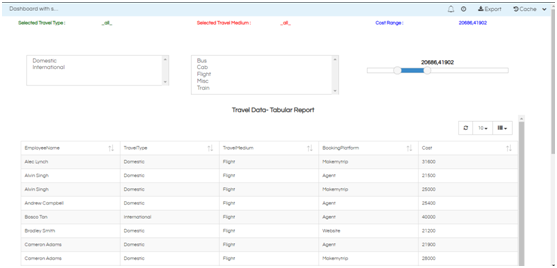
After changing filter values we can see in below image that the selected filters are getting displayed like “Domestic”, “Bus,Cab,Flight…”:
