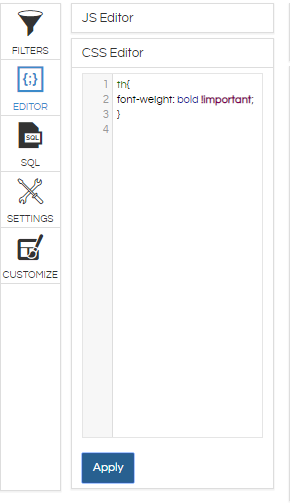
Editor Tab is especially for the developers who can modify the results using HTML & CSS.
At the report level interface you can see Editor Icon clicking on that you can see two options i.e. JS Editor & CSS Editor.
1. JS editor: Users can write Java scripts in this section for adding customizations like Row banding, changing axes labels, tool tip information etc.
Note: Helical Insight uses C3, D3, Leaflet & datatables. Thus, any JS relevant to these can only be used.
2. CSS editor: Users can use any CSS/HTML for changing Font colour, type, transparency etc.
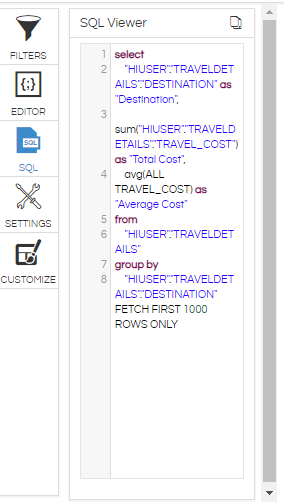
3. SQL Viewer: Any columns selected in the selection area or any operations done on them will automatically generate a SQL query which can be seen in the window as shown below. Users can only view this SQL query and cannot edit it.
For More Info, Contact us at demo@helicalinsight.com
At the report level interface you can see Editor Icon clicking on that you can see two options i.e. JS Editor & CSS Editor
NOTE: When you apply a CSS and Javascript, it might be relevant to only that specific chart API. Hence without removing it if you simply click on some other chart there is a very good chance that the chart will not render and it will on show loading. This is because the Javascript code / CSS HTML code which you have put is trying to get applied but those relevant APIs, classes etc are not present. Thus it is very important to delete the applied JS CSS HTML code before you change chart types from one chart to another chart.


