Introduction : In this blog we are going to explain how to implement data security based on the logged-in user in community edition reports.
In this sample report we are showing data of destination wise travel cost. The report data is filtered as based on the logged-in user (in this case destination is treated as username), hence whatever is the city name of the logged-in user he will only see that data.
Please make sure you have gone through the blog “Introduction to Community Reporting Interface”
Steps to implement Data Security in Community report
- Data Source
- Dashboard Layout
- Parameter
- Report
-
- Data source :
Create data source connection. The connection is created with default name “connection1”. We can rename the parameter using pencil icon. We should select the connection type: Groovy Plan Jdbc. Please note that if you want to apply data security you have to use Groovy Plain JDBC only.
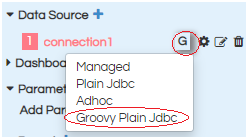
If you click on configure icon, the data source configuration place holder will be opened


Configuration code :
<driver>com.mysql.jdbc.Driver</driver> //driver
<url>jdbc:mysql://localhost:3306/SampleTravelData</url>//jdbc database url
<user>hiuser</user>//db username
<pass>hiuser</pass>//db password

import net.sf.json.JSONObject;
public JSONObject evalCondition() {
JSONObject responseJson = new JSONObject();
responseJson.put("driver","com.mysql.jdbc.Driver"); // driver name
responseJson.put("url","jdbc:mysql://192.168.2.51:3306/SampleTravelData"); //jdbc database url
responseJson.put("user","hiuser"); //db username
responseJson.put("password","hiuser"); //db password
return responseJson;
}
Note : In the above configuration we are providing mySQL database details, make sure that the mySQL driver has been uploaded from the frontend ( or the relevant driver is present in the drivers folder at the backend.
Refer to this link to understand How to Add a New Driver
-
- Dashboard Layout :
In the dashboard layout we basically specify the layout of the report, dashboards, input parameters which we are creating. All the divs are specified here within which they get rendered.
We are creating div with name : emp_details
When you click on dashboard layout a layout similar to below will appear:

In the above screen shot we find two options (left side)
HTML and CSS .
If you click on HTML/CSS the place holder for respective component will be displayed and highlighted in the Dashboard layout panel.
We can place the code related to HTML, CSS for dashboard layout and styling.
Dashboard layout:
HTML Code:
<script type="text/javascript" charset="utf8" src="https://cdn.datatables.net/1.10.19/js/jquery.dataTables.js"></script>
<div class = "col-sm-12 col-md-12 col-xs-12" id="dest_wise_travelCost"></div>
CSS:
In CSS place holder we can add the CSS related to Tabular customization as well as report customization like back-ground color, report border , border radius, color etc.
-
- Parameters :
In this report we are not creating parameters. You can skip this section.
Note : Since we are not creating parameters , we should include the below lines of code in the report configuration.
var dashboard = Dashboard;
Dashboard.resetAll();
-
- Report :
We can configure different visualizations to render in different divs in the dashboard layout.
When click on add report button, the layout will appear as shown below :

By default the report name is created with “report1”. Here we have renamed as “Tabular” and select chart type as “Table”
Report Configuration :
var dashboard = Dashboard;
Dashboard.resetAll();

var Table = {
    name: "Table",
	type:  "chart",
	listeners:[],
	requestParameters : {

	},
	vf : {
		id : 1,
		file : "__efwvf_name__"
	},
    htmlElementId : "#dest_wise_travelCost",
    executeAtStart: true
};
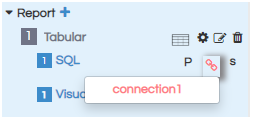
In the SQL section : choose the connection as “connection1”(As earlier created in the data source section)
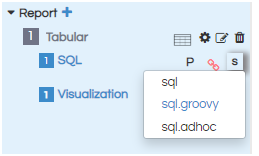
Select SQL type as “sql.groovy”
SQL :
In the SQL section, we write the query that will be executed to generate the report data. Here, we shall specify a where clause in order to filter out the data based on the user name that we get from the Sessions variable. The session details are stored in GroovyUsersSession object.
import com.helicalinsight.efw.utility.GroovyUsersSession;
public String evalCondition() {

String userName = GroovyUsersSession.getValue('${user}.name');
userName = userName.replaceAll("'","");

String responseJson;

String selectClause = "select destination,travel_cost from travel_details ";


whereClause = "where destination='${userName}' "

responseJson = selectClause+ "" +whereClause;

return responseJson;
}
Note : We can give filter conditions based on our requirement in the query
Visualization :
In the visualization section, we must specify the dimensions and measures that will be part of the tabular data that we want to visualize.
<Dimensions>destination</Dimensions>
<Measures>travel_cost</Measures>
Note: After providing the Configuration, SQL , Visualization then click on apply or (Ctrl+s)
After completing all the steps save the report using the Save icon on the top ribbon.
At the back end server location, inside hi-repository, the following files gets created:
- Efw (Report View file which can also be accessed from the file browser from the frotnend)
- Efwce (Report edit file which can also be accessed from the file browser from the frontend, this file can be used to edit the EFWCE report being created)
- Efwvf :: This file contains the information about the visualization being used.
- Html :: This file contains HTML layout, CSS, parameters divs etc.
- Efwd :: This file has got all the datasource related details
In the front end file browser we can see the below file types:
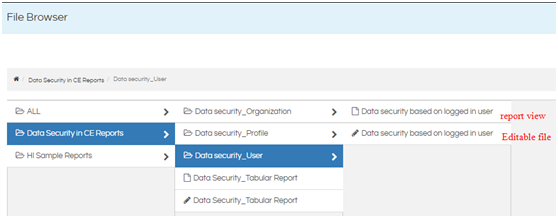
When we double click on the report view file (with the extension efw) report opens like below. The other file with the extension EFWCE can be used to edit the created report/dashboard again.
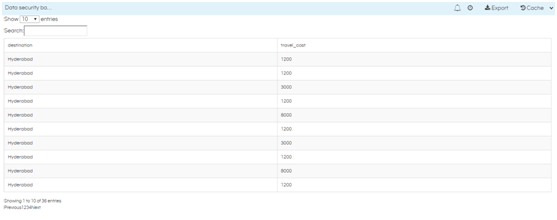
Report view test case 1 :
Report view when we logged in with USER name : Hyderabad
Then we can see below only Hyderabad relevant data is being shown.
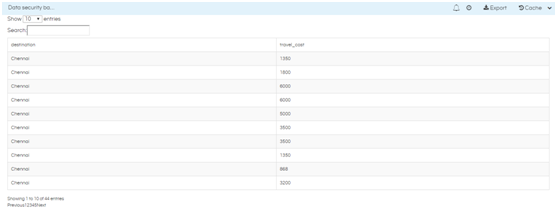
Report view test case 2 :
Report view when we logged in with USER : Chennai
Refresh the report cache in order to avoid cache data
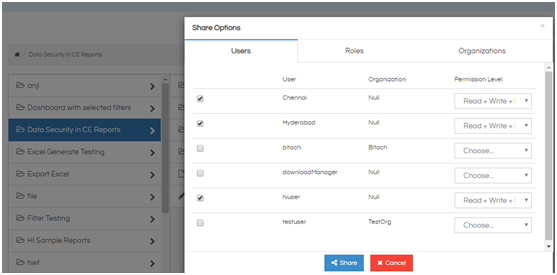
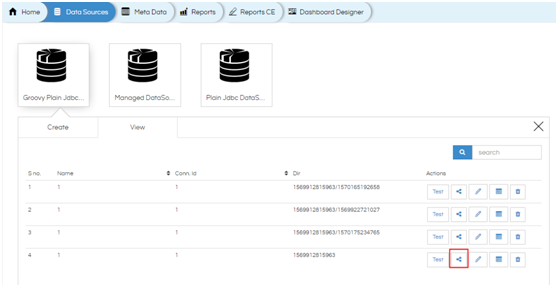
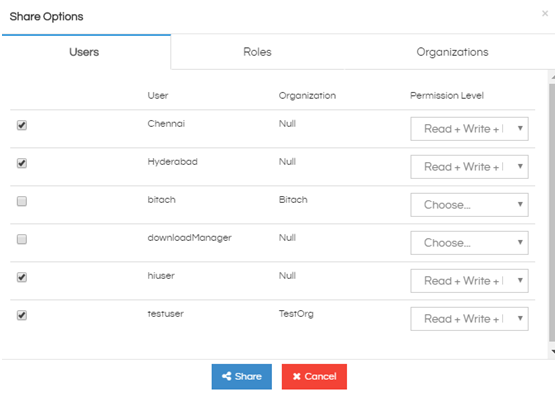
Note : In order to view the report when logged in as another user, the report and the Groovy Data source need to be shared with the users with proper permissions from the file browser.
For more details on EFWCE reporting refer the documentation :
Introduction to Comunity Reporting Interface
For further assistance, kindly contact us on support@helicalinsight.com or post your queries at Helical Insight Forum
