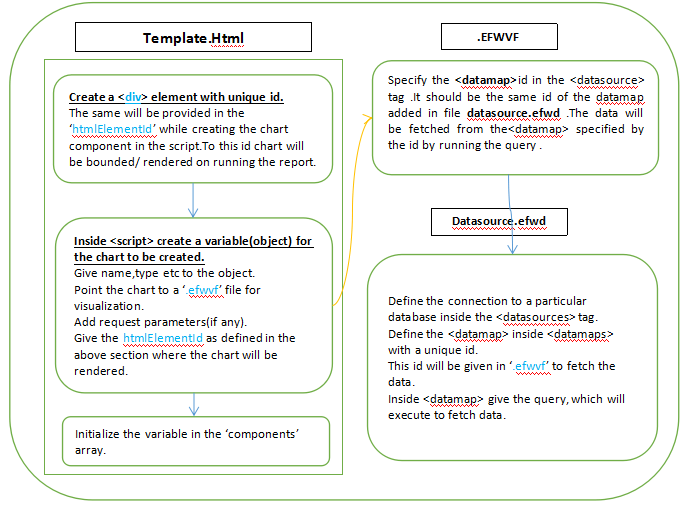
In this article we will learn how to create a dashboard with multiple reports in it. For creating a single report, we create a <div> with a unique id and leave it empty for the chart to be rendered in it. On running the report, chart will be rendered in the created <div>. Define the component in the <script> tag inside Template.html file and then initialize the dashboard components.
In the same manner, we can create multiple reports by following the above steps of creating new <div>.

Since the table report is already there, we will be adding a report where the visualization file (barChart.efwvf) will be used. Thus a bar chart will appear besides table report.
We will align the HTML <div> in the same manner.
Open Template.html file to add the div where the next report has to appear.
<div class="row reportsDiv">
	<div class="col-sm-6" id="tableChart"></div>
	<div class="col-sm-6" id="barChart"</div>
</div>
In the above snippet, define the <div> and give it a unique id. In our case, unique id is ‘#barChart’ where the chart will be bounded/rendered on running the report.
Note:- In our layout we have defined the charts side by side. User can change the layout by changing the HTML markup as per the choice.
Now, in the same Template.Html file, add a new component (object variable) inside the <script> tag.
Copy already defined Chart component (shown below).
var chart = {
    name: "chart",
    type:  "chart",
    vf : {
	id : 1,
	file : "Table.efwvf"
    },
    requestParameters : {
	start_date: "s_date",
	end_date: "e_date"
    },
    htmlElementId : "#tableChart",
    executeAtStart: true
};
Copy the above component and create a new component for bar chart.
var  barChart = {
    name: "chart",
    type:  "chart",
    vf : {
	id : 1,
	file : "BarChart.efwvf"
    },
    requestParameters : {
	start_date: "s_date",
	end_date: "e_date"
    },
    htmlElementId : "#barChart",
    executeAtStart: true
};
- Change the variable/component from chart to barChart.
- For bar chart visualization, change file from Table.efwvf to barChart.efwvf.
- The chart will be rendered to the
defined in HTML section with unique ID.Hence, provide the same ID #barChart in the htmlElementId .
Now that we have defined the components, we need to initialize the same in component array and then on the dashboard.
var components = [runButton, start_date,end_date,chart,barChart];
dashboard.init(components);
- Insert BarChart component defined above in the component array.
- Initialize the components on the dashboard.
Save the Template.html file after making the above changes and run the report from the appication.

Here we are using same parameters in the bar chart as well. Thus the data of bar chart will be corresponding to the parameters selected from the input box. On click of submit button, bar chart must also get triggered.
var runButton = {
    name: "runButton",
    triggers:["chart",”barChart”], // Add ‘barchart’ here ,so now it will also trigger/run on cllick of the button
    type:  "button",
    options:{
	display: "Submit"
    },
    htmlElementId : "#runButton",
    executeAtStart: false
};
- Add barChart in the triggers.
Note:- Here both the charts are showing the same data, since by default only one is defined in the Datasource.efwd and the .efwvf files are pointing to same.
Now, if you want the bar chart to be added and show the data of your choice, you need to create datasource connection (in case you want to use any other database instead of the one already defined) in the datasource.efwd file.
Then create <Datamap> with a unique id and write your query in it to fetch the data.
Then pass the same id to the BarChart.efwvf file (inside the <datasource> tag).
Thus, now the bar chart will be displaying the data your choice.
Refer the link: How to create report in Helical Insight CE
