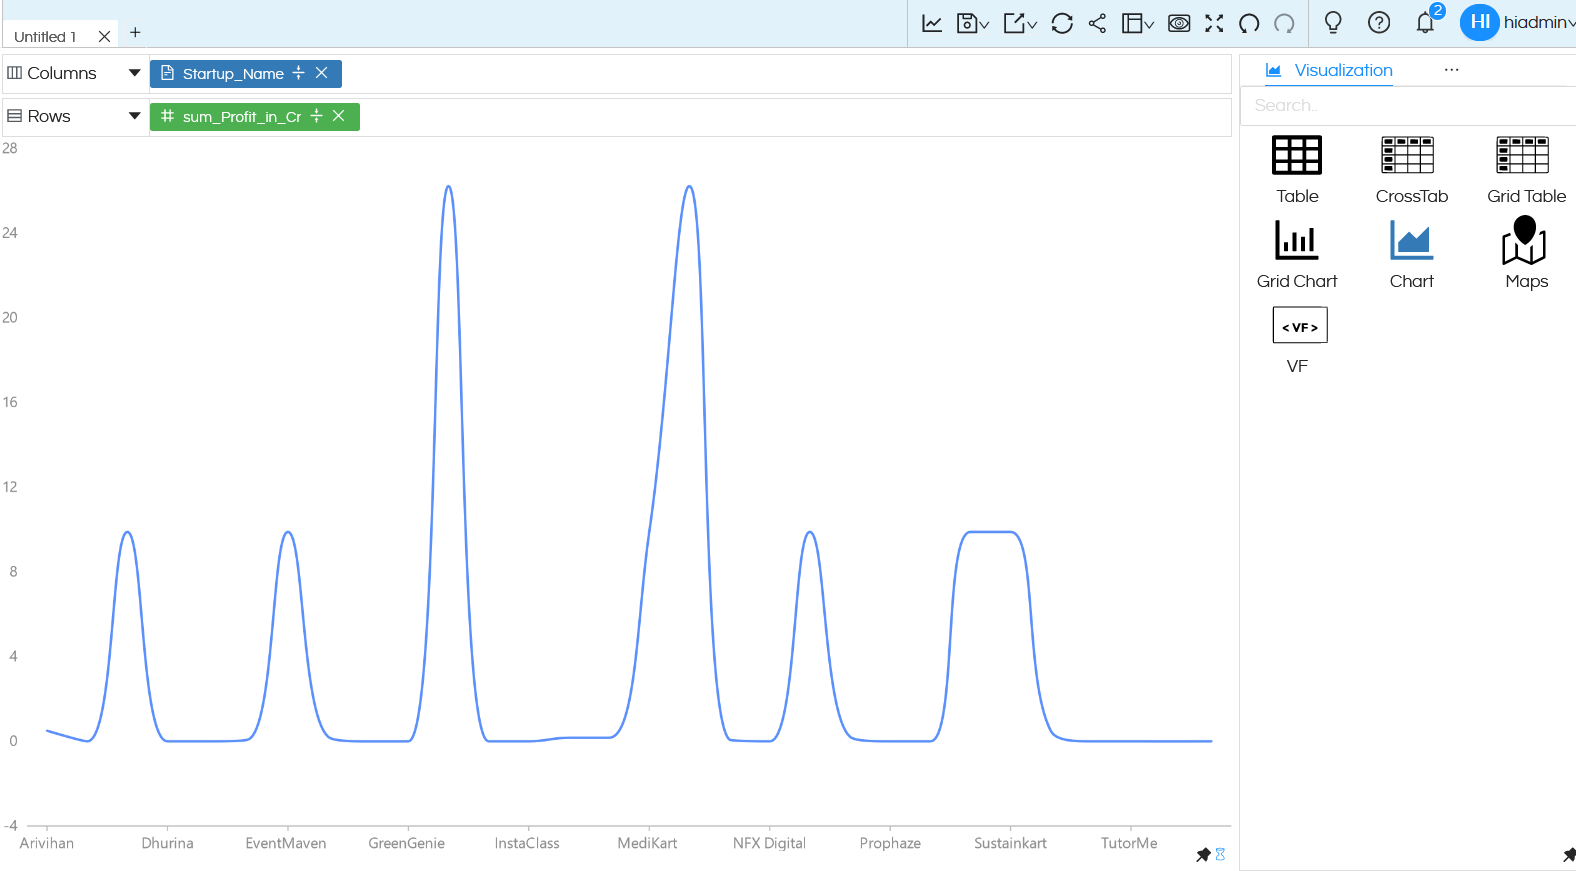
By default when we create a line chart in Helical Insight version 5.0 onwards it has got sharp edges. But from version 5.2 (5.2.0.1473 GA) a new property has been introduced which can allow to create line charts with smooth edges.
Usage:
Create a line chart report. For example here we are created a report with two columns.
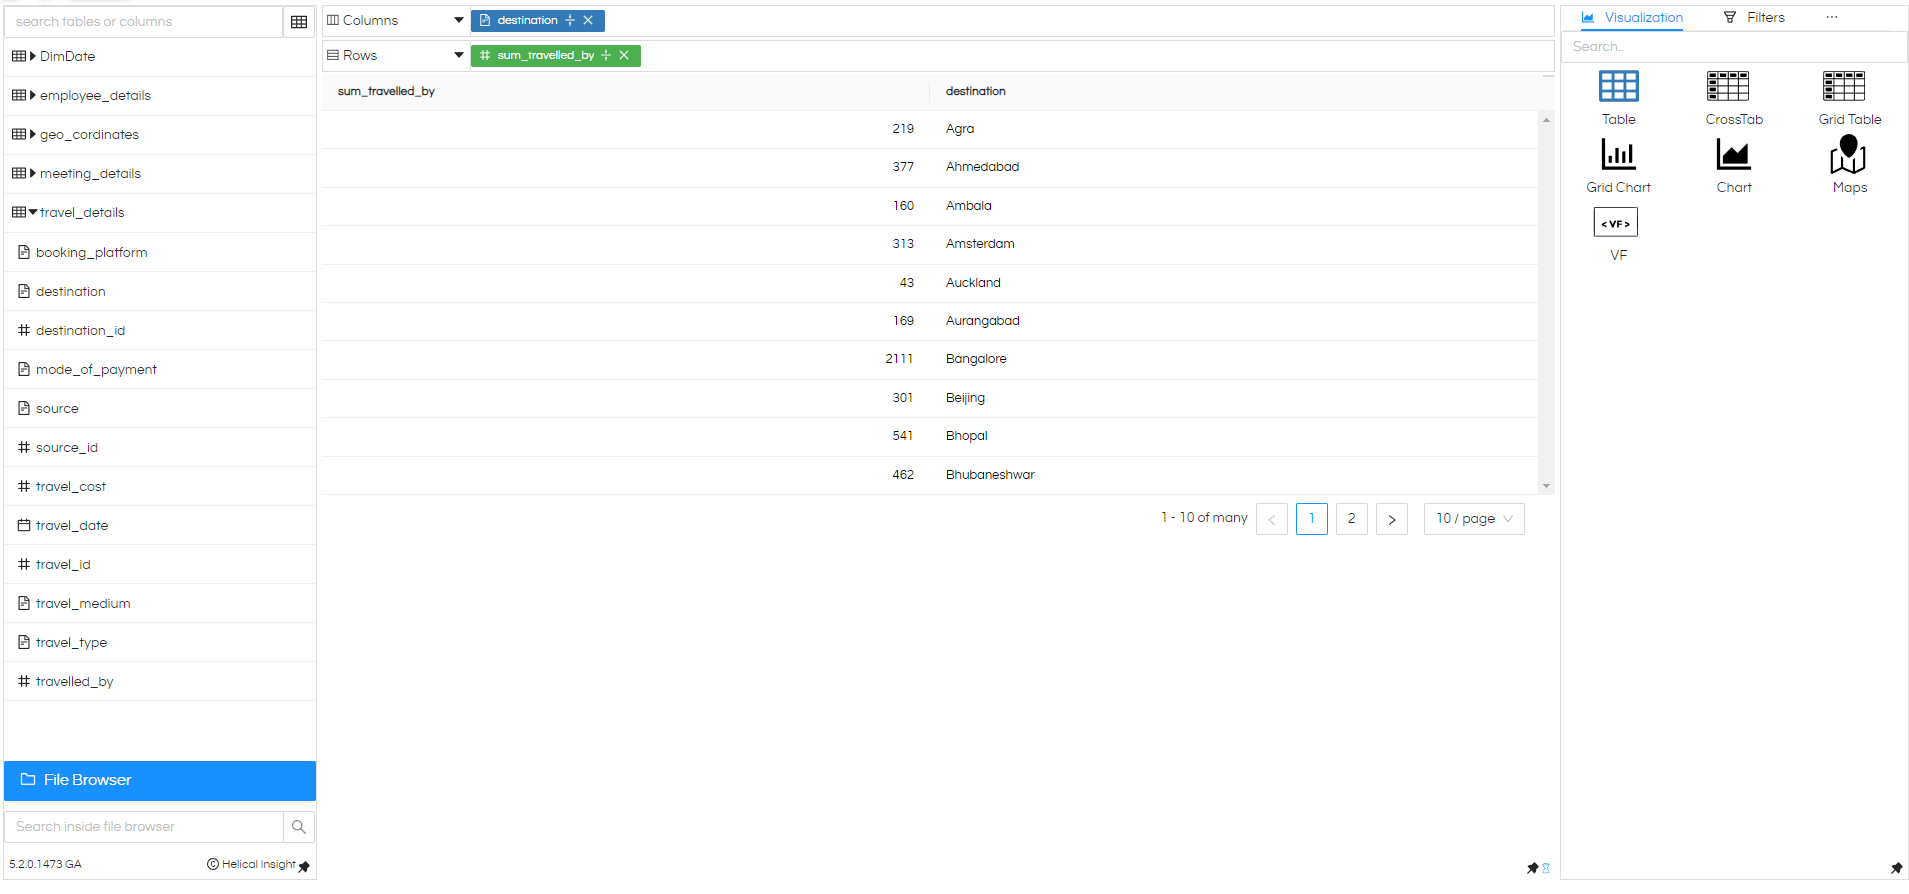
Now click on Grid Chart/ Charts and it will turn into a bar chart.
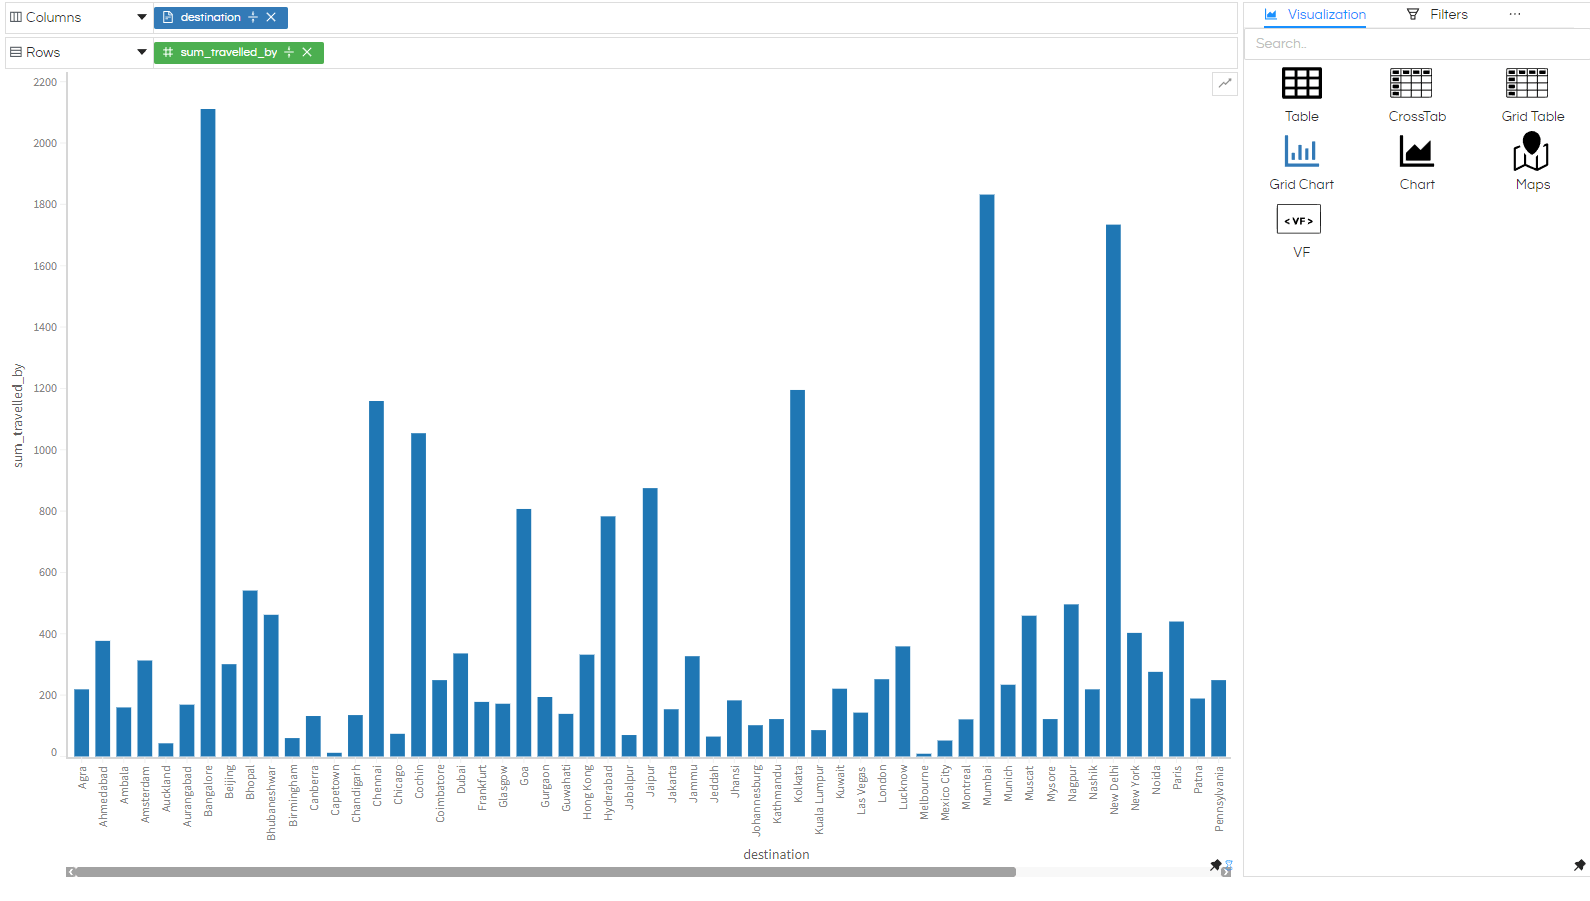
Now go to Marks By clicking on 3 dots beside Filters Option.
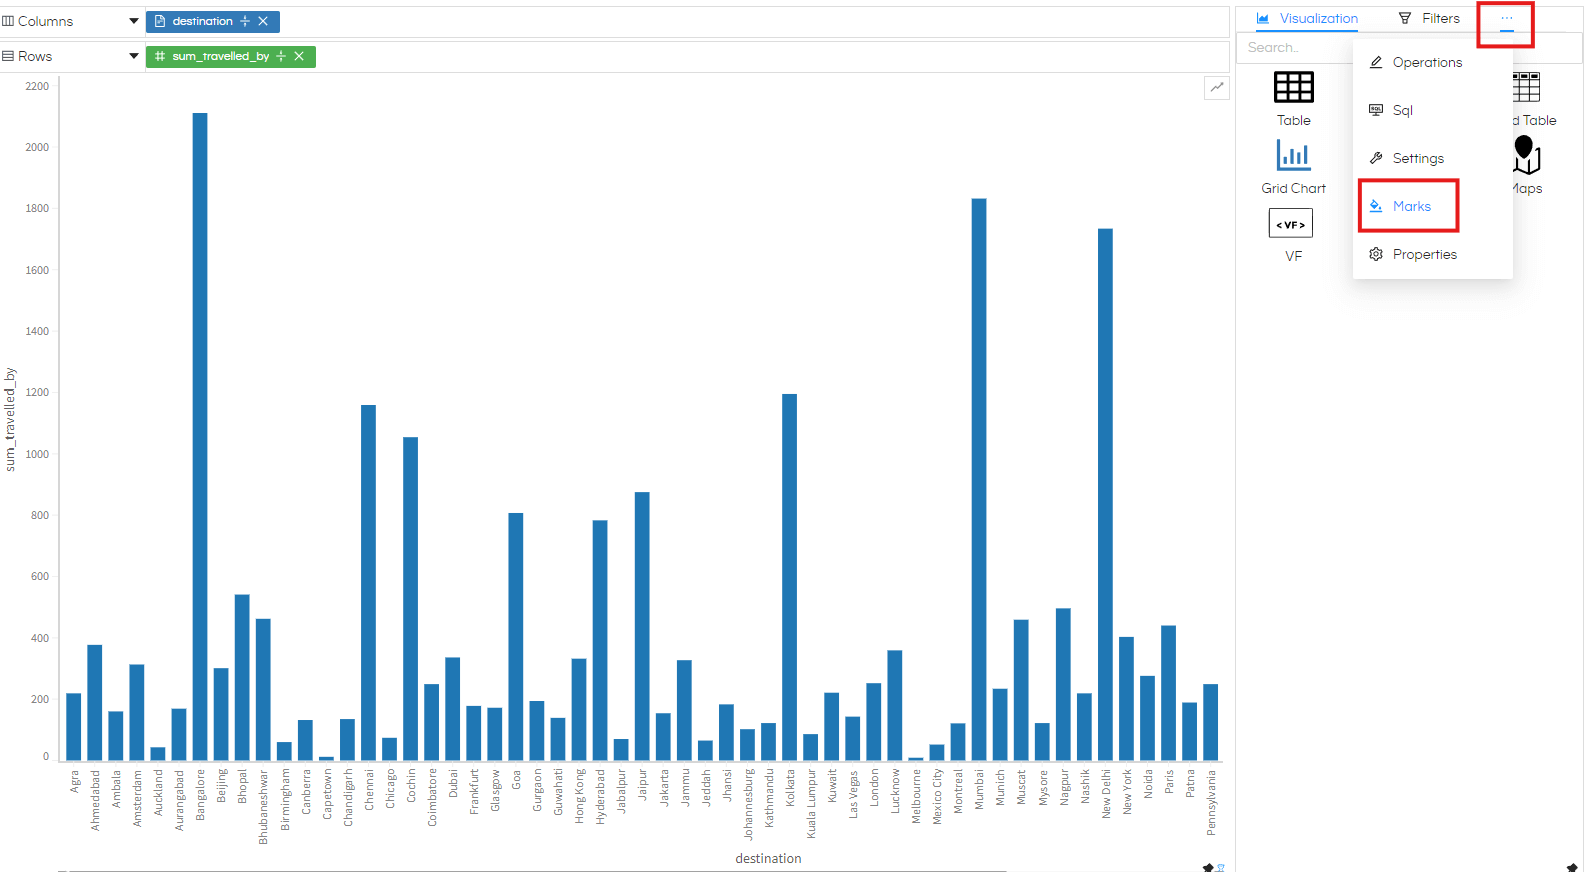
Now In marks expand All and change Bar to Line.
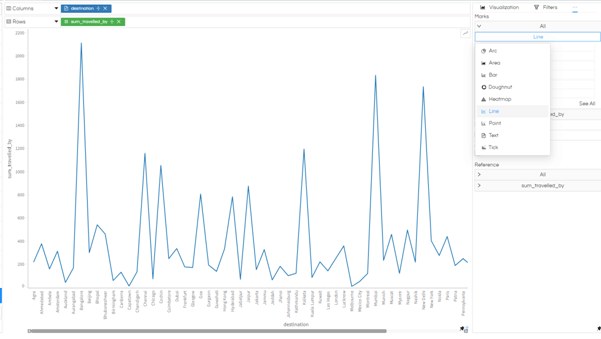
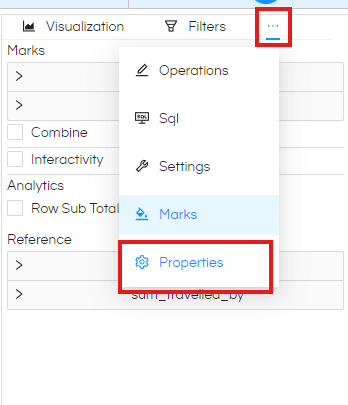
You can see here the edges are very sharp. To make them smooth go to Properties. You can do that by hover on same three dots besides Filters and then click on Properties.
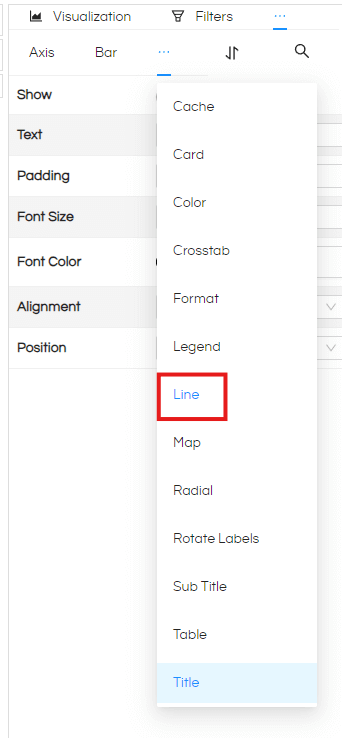
Now again hover on 3 dots beside Bar, in that you can observe a new option called Line. Click on it.
After clicking on Line property. You can see an option called Smooth. Enable it and click on Apply Button. Regenerate the report.
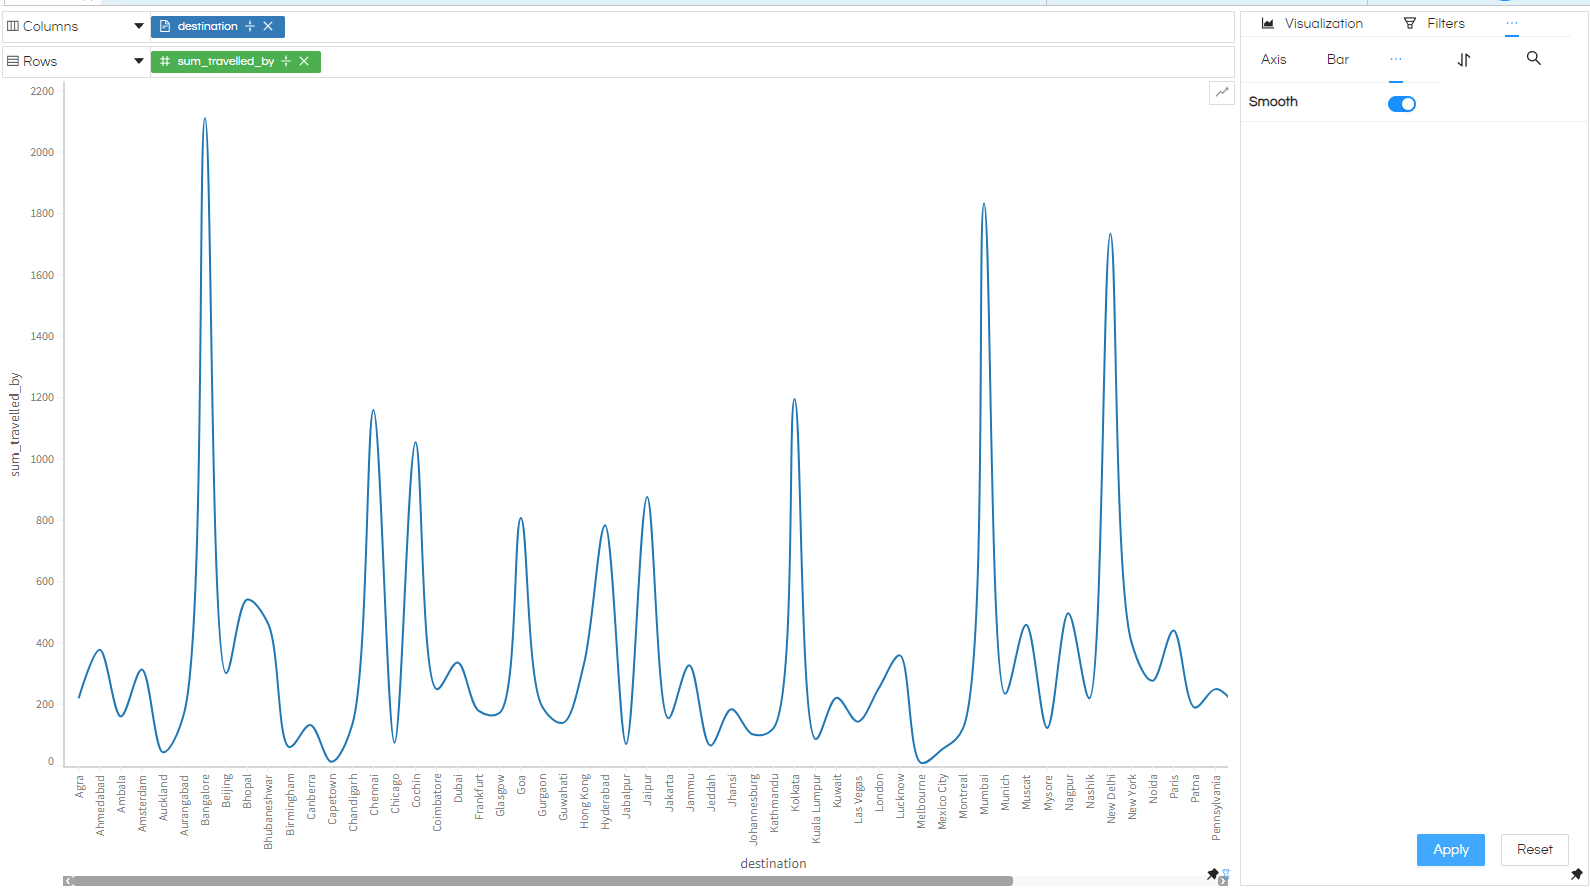
Now you can see the edges are smoother now. This functionality will work on line charts created using both Grid Charts and Charts.
