With Helical Insight being a BI framework, here you can find examples of how we are redefining the boundaries of BI. Have a look at some really miscellaneous and interesting use cases in action.
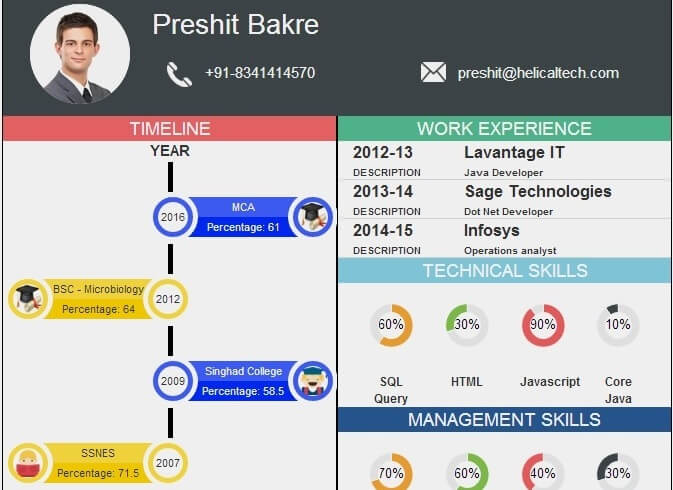
Build visually stunning infographs easily with charts, text, images, animation and pixel perfect formatting. In demo see a CV in form of an infograph.


Change parameters and see its effect on the output using What If analysis. Build complex what if analysis like EMI calculator, sales forecast etc using Helical Insight.

Use Helical Insight online to explore powerful open-source BI in our cloud/sandbox — no installation needed.
