We had a version 5.2 release of our Open Source BI product Helical Insight in May’2024, information of which can be found here. In 3 months, we are ready with version 5.2.1 with many more exciting enhancements which we have covered in this blog.
-
- DataSource Layer: With the every increasing support and usage of SaaS applications, we have included support of below options which can help in more diverse data analysis
- API: With ever increasing usage of SaaS, support of API can allow Helical Insight to be used for a much more diverse data analysis purposes. Any API which returns data in the form of JSON can be used now.
- Support of flat files: Now we are directly supporting flat files like Excel, CSV, JSON, Parquet, TSV etc which can be used for data analysis and reporting purposes.
- Google sheet support
- Flat files stored in Cloud support: These above mentioned flat files can also be present on Google Cloud, AWS, Azure storage and from there also it can be consumed and used.
- DataSource Layer: With the every increasing support and usage of SaaS applications, we have included support of below options which can help in more diverse data analysis

-
- Metadata Module: Metadata module of Helical Insight has a functionality called as Views which allows to write custom SQL for handling more complex data analysis.
From version 5.2.1, we are allowing a preview of the view data. Thus quickly allowing users to identify whether the written SQL is generating correct response or not.
- Metadata Module: Metadata module of Helical Insight has a functionality called as Views which allows to write custom SQL for handling more complex data analysis.

-
- Adhoc Report Designer :In the newer version, newer charts options and newer customization options have been introduced. Below we have covered the list of
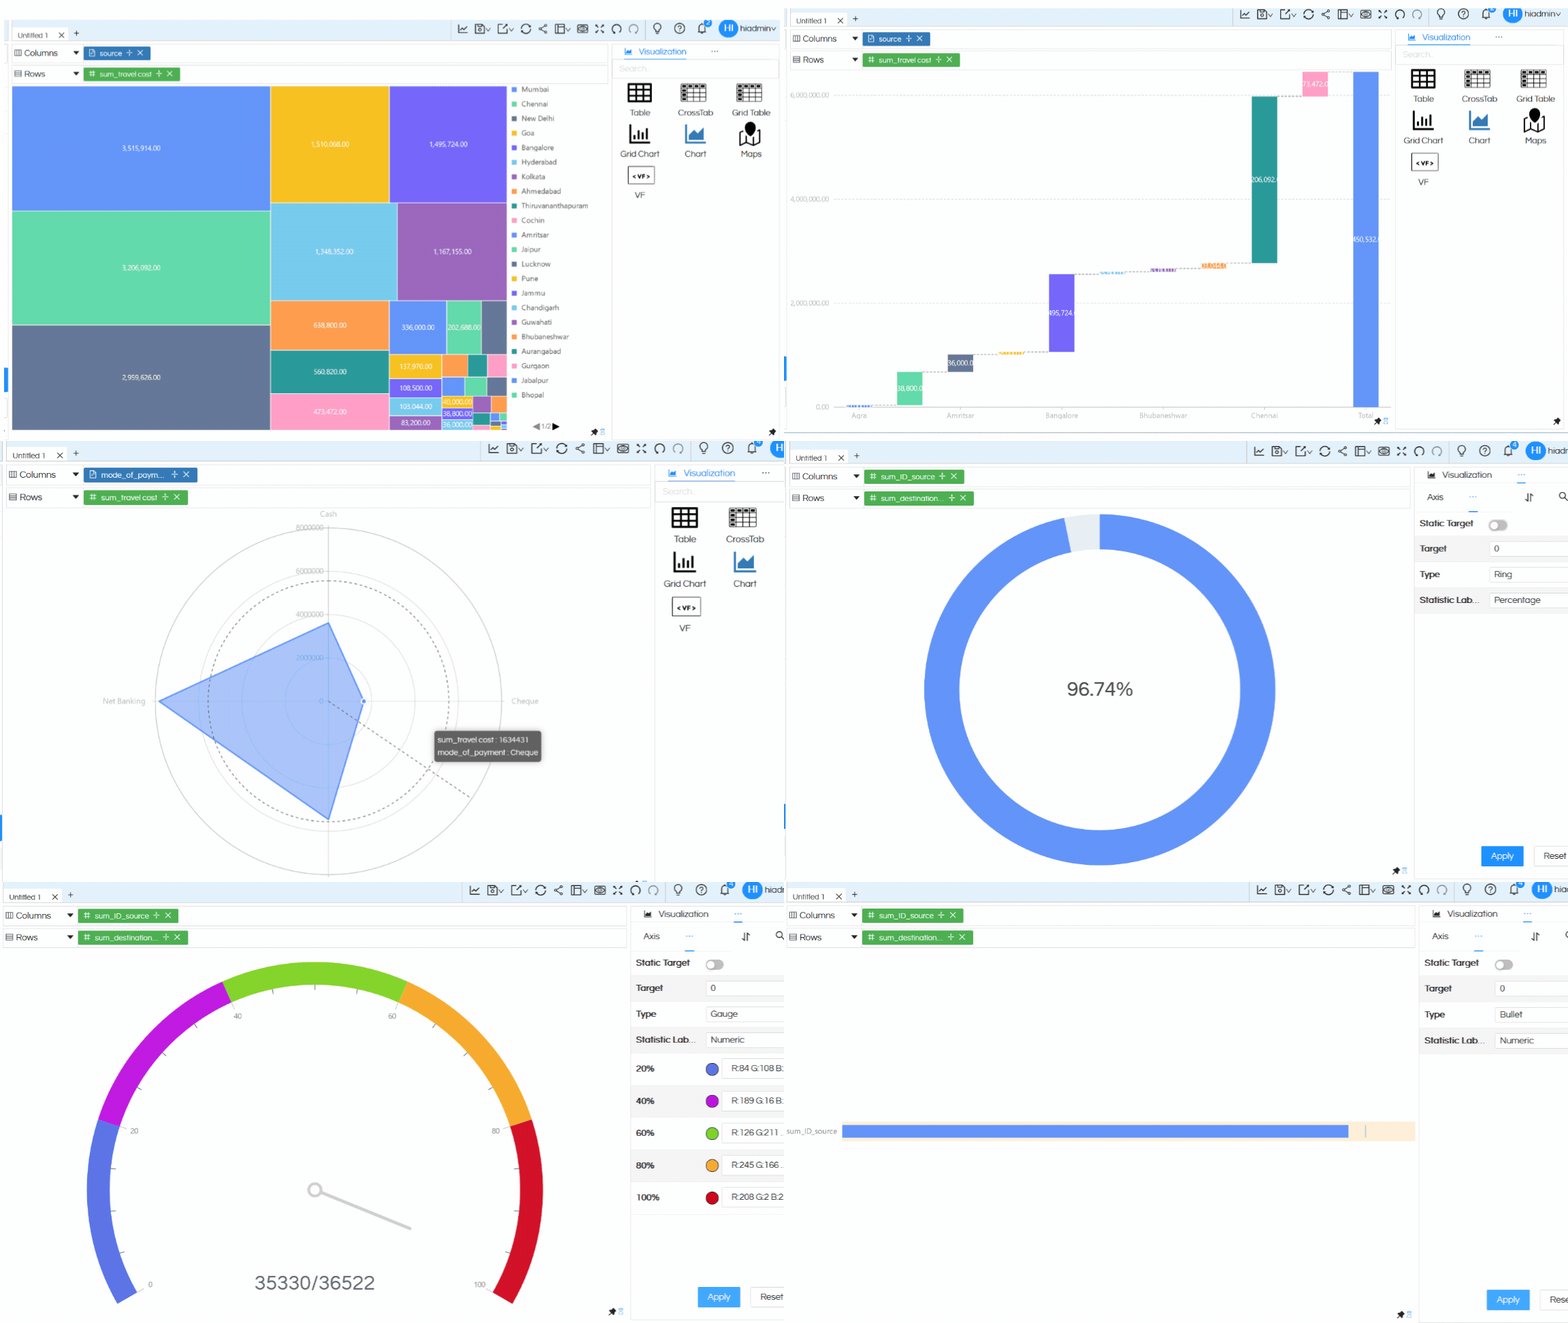
- Newer Visualizations: From version 5.2.1 of Helical Insight, we have introduced multiple newer kind of visualization options which includes
- Treemap charts: Usage video
- Water fall charts: Usage video
- Radar charts: Usage video
- Progress Charts (Tiny Ring chart), Gauge Chart and Bullet Chart: Usage video
- New Customization options: From version 5.2.1, below mentioned are the list of newer chart customization options which have been added
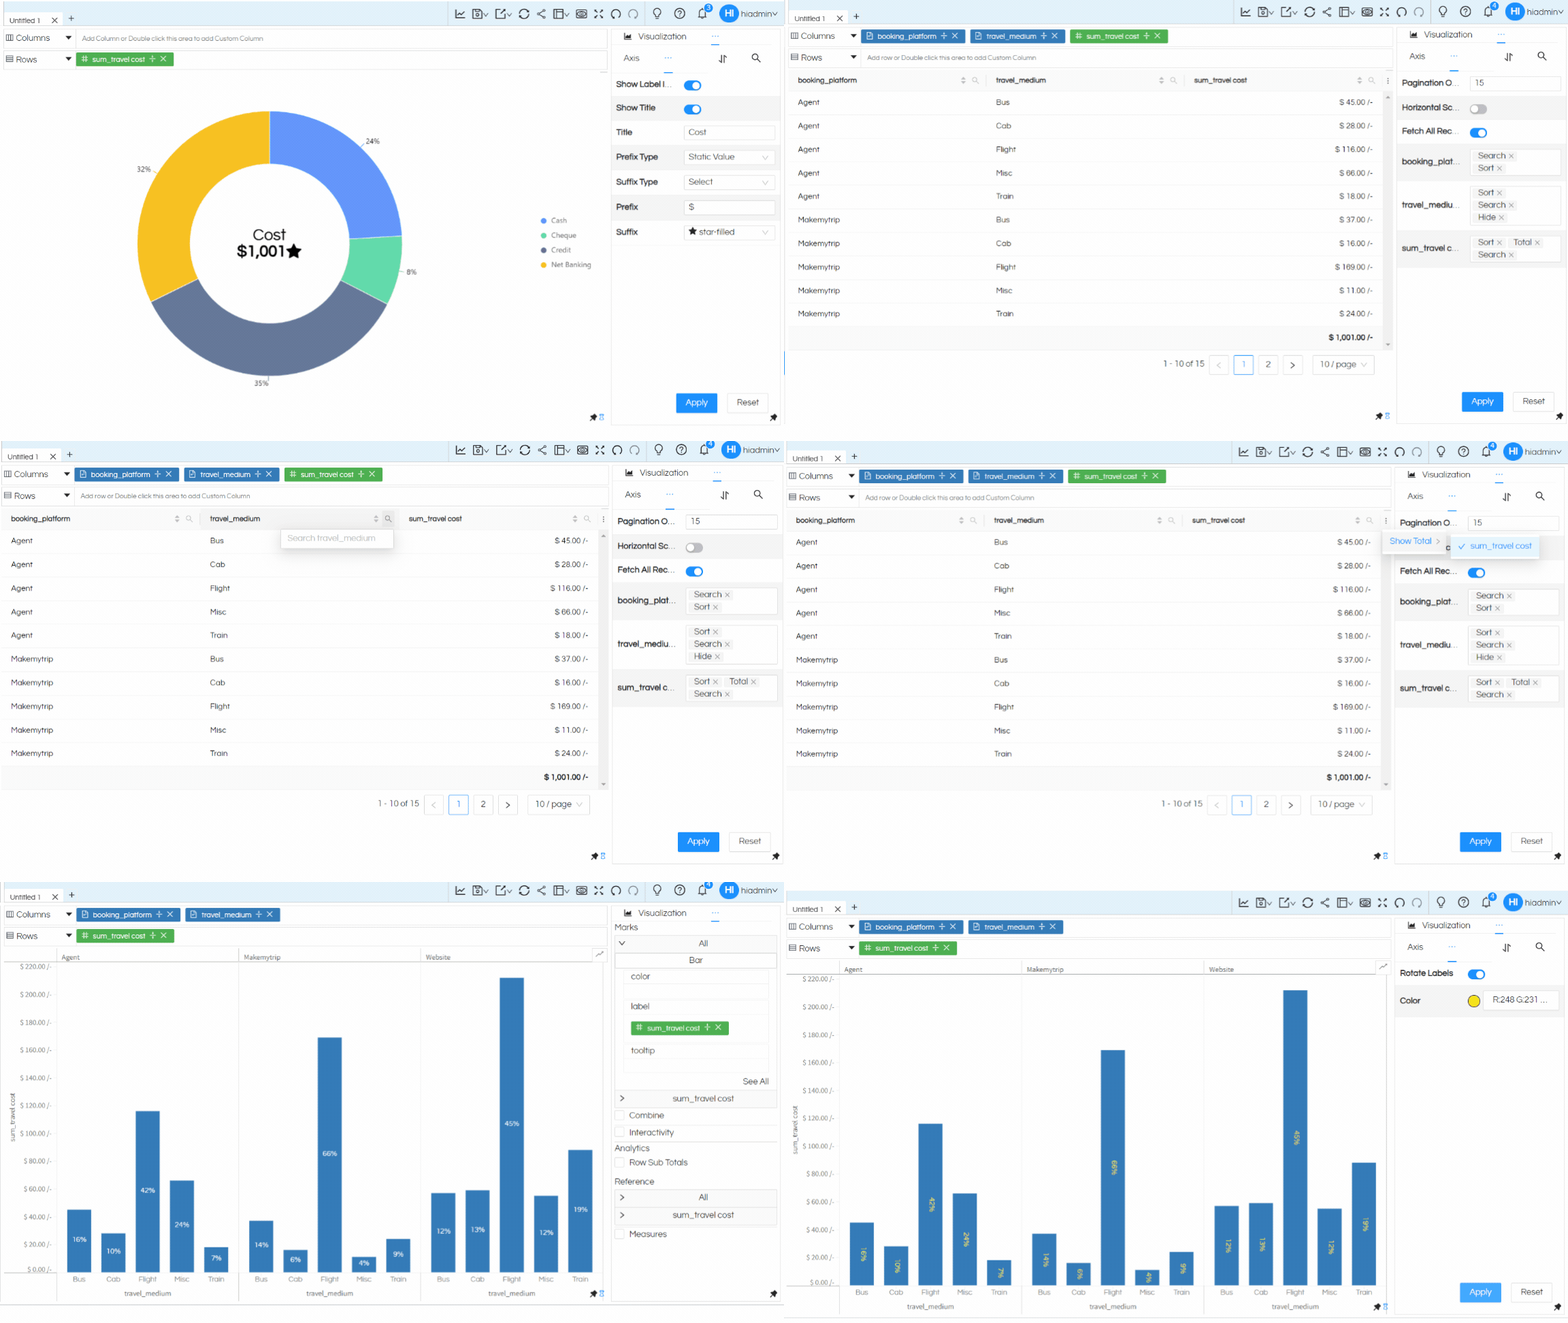
- Donut: In donut, many new options have been added which can allow to add Total, Image, static text, SVG etc at the centre of Donut chart.
- Table: In the tables, newer customization options have been added which can allow to enable options like sorting, filtering, enable Grand Total kind of options, hide/show for any column as required. Usage video.
- Data Labels: Data labels now have additional customization options like the color as well as rotation of those data labels. Usage video
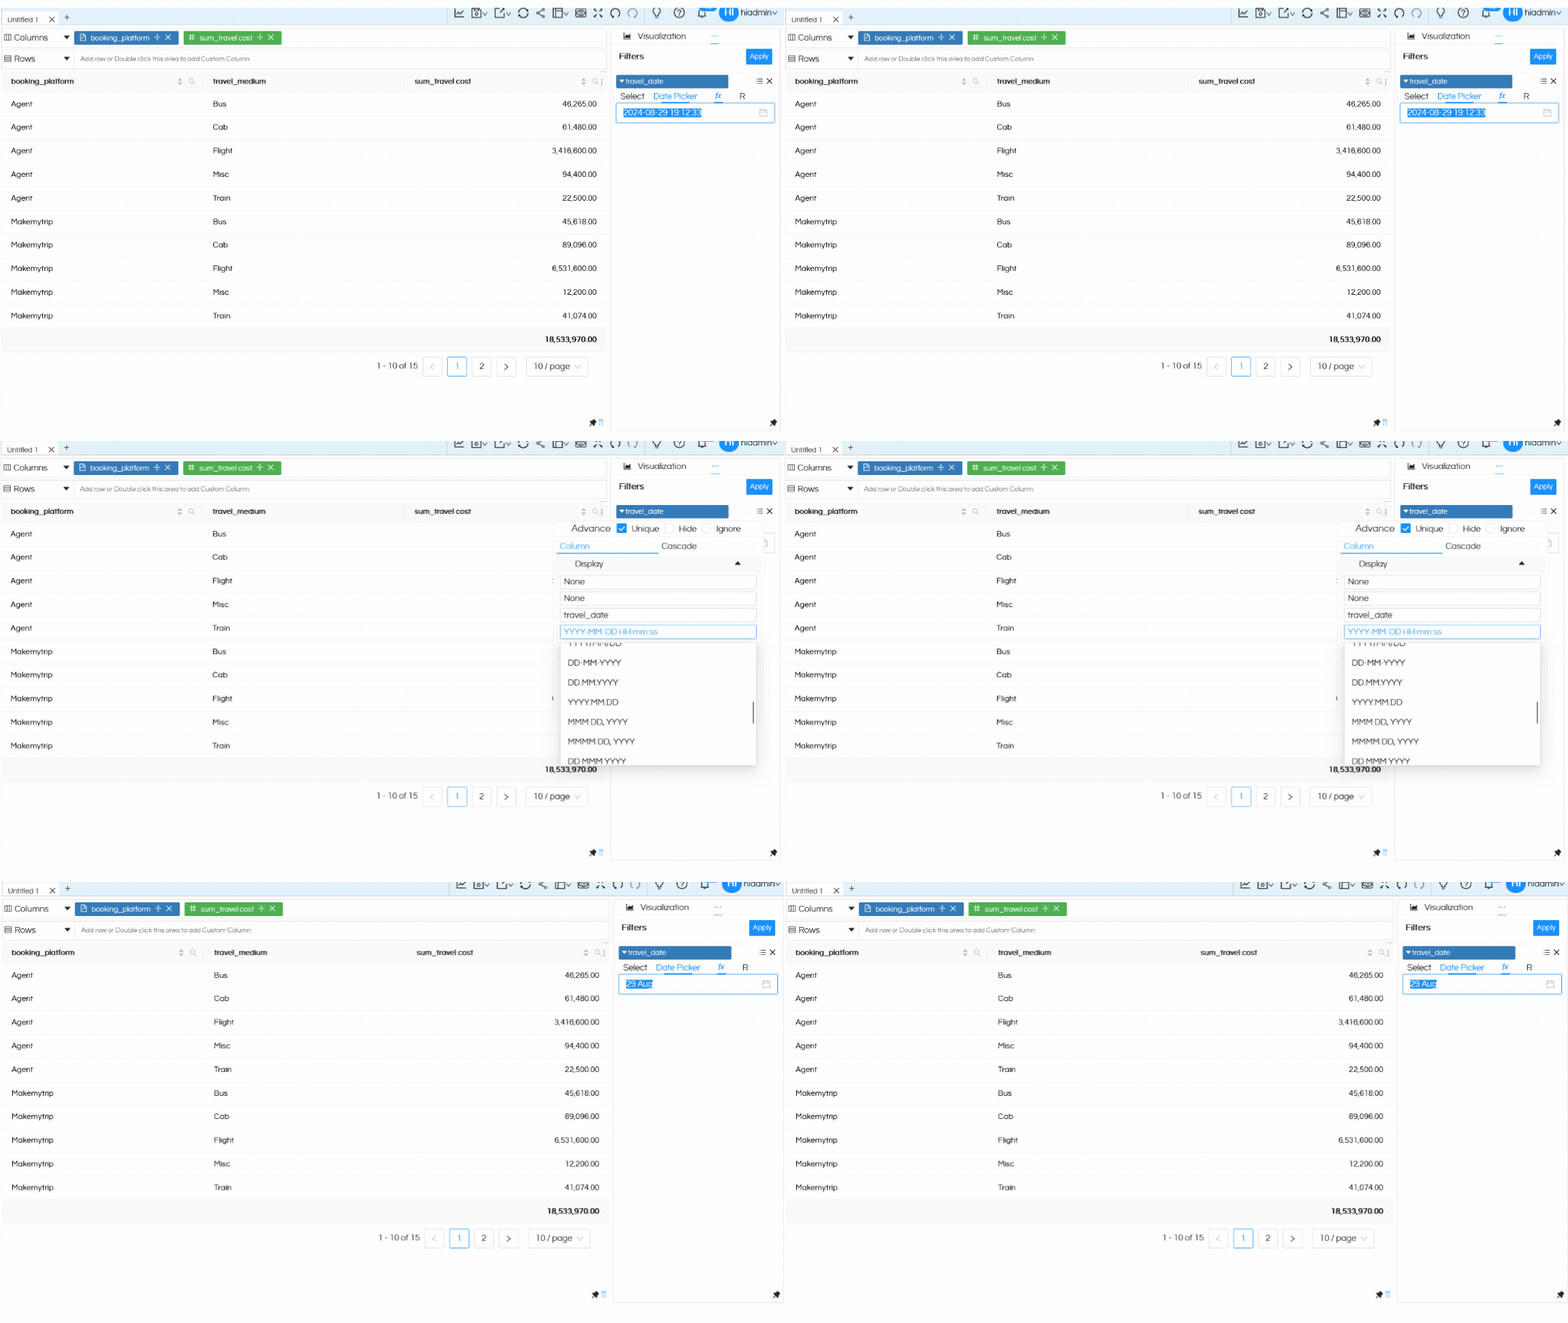
- Filters Date UI customization option :With version 5.2.1, we have introduced an option allowing users to customize how the format in which date appears in the date field selection box. This is especially useful for customer from other regions who want to display date fields in a custom way.
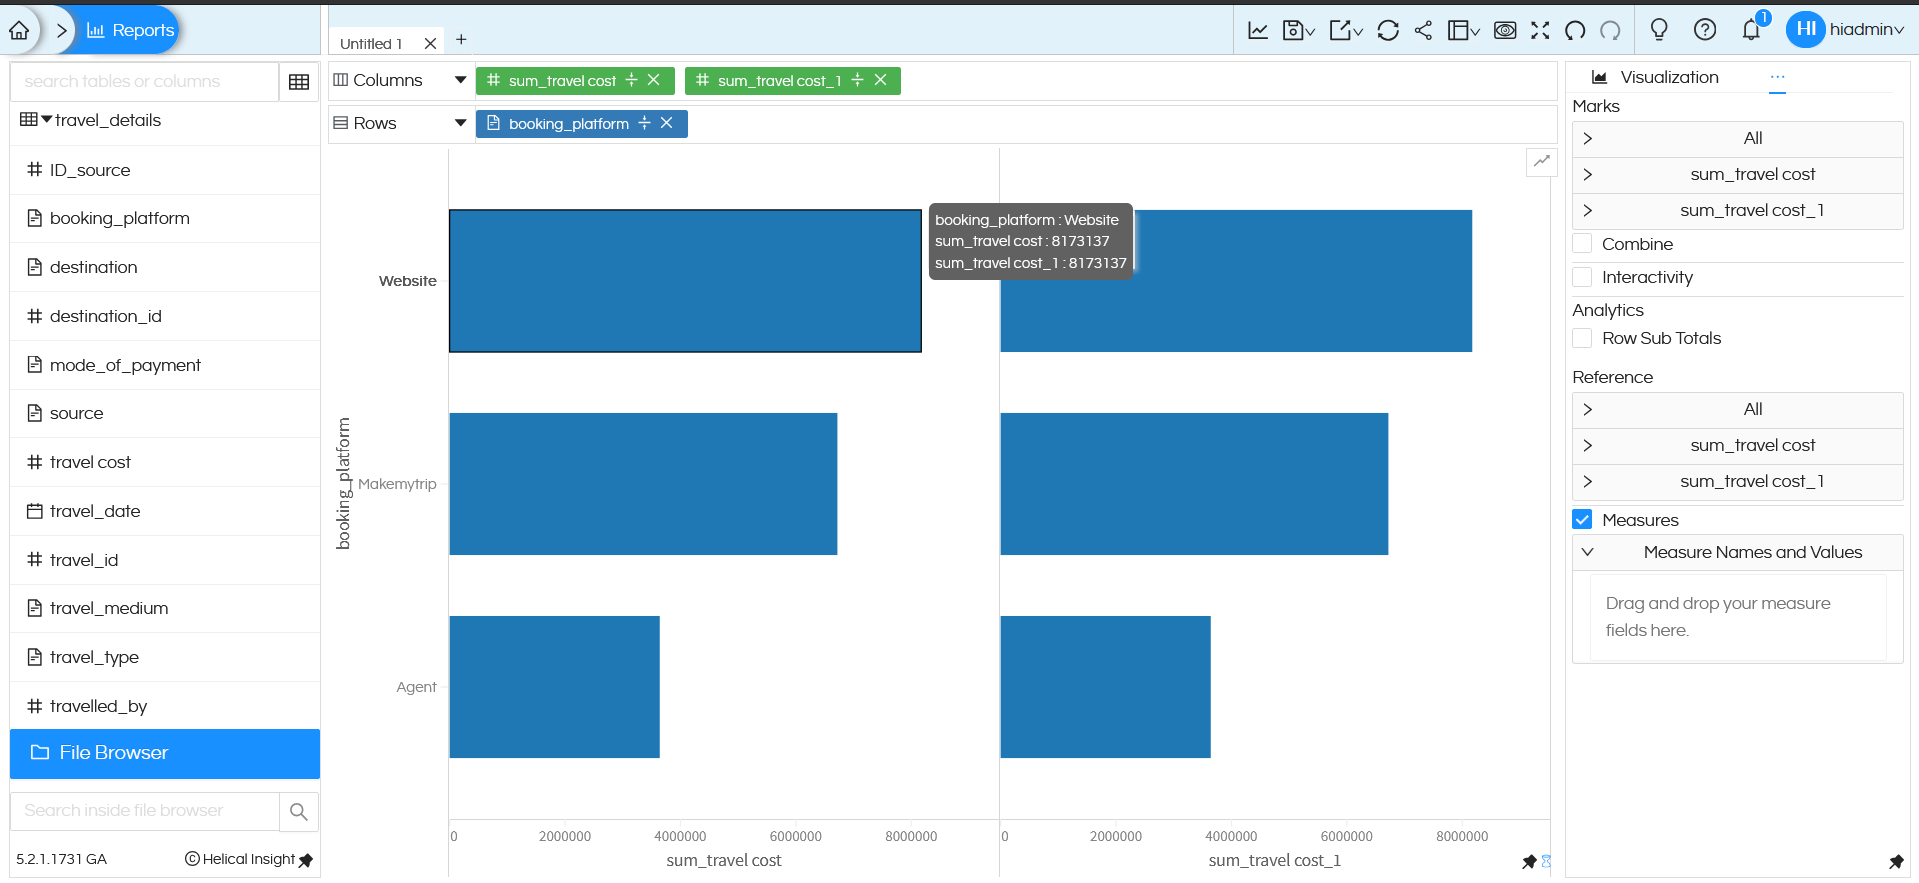
- Measures: An altogether new functionality which has been introduced from version 5.2.1 is called Measures.These measures allows to create some fields which can then be used. Read more here.
- Newer Visualizations: From version 5.2.1 of Helical Insight, we have introduced multiple newer kind of visualization options which includes
- Adhoc Report Designer :In the newer version, newer charts options and newer customization options have been introduced. Below we have covered the list of
-
- Dashboard Designer: Dashboard designer has undersgone lot of enhancements from version 5.2.1 allowing many more options, functionalities and controls.
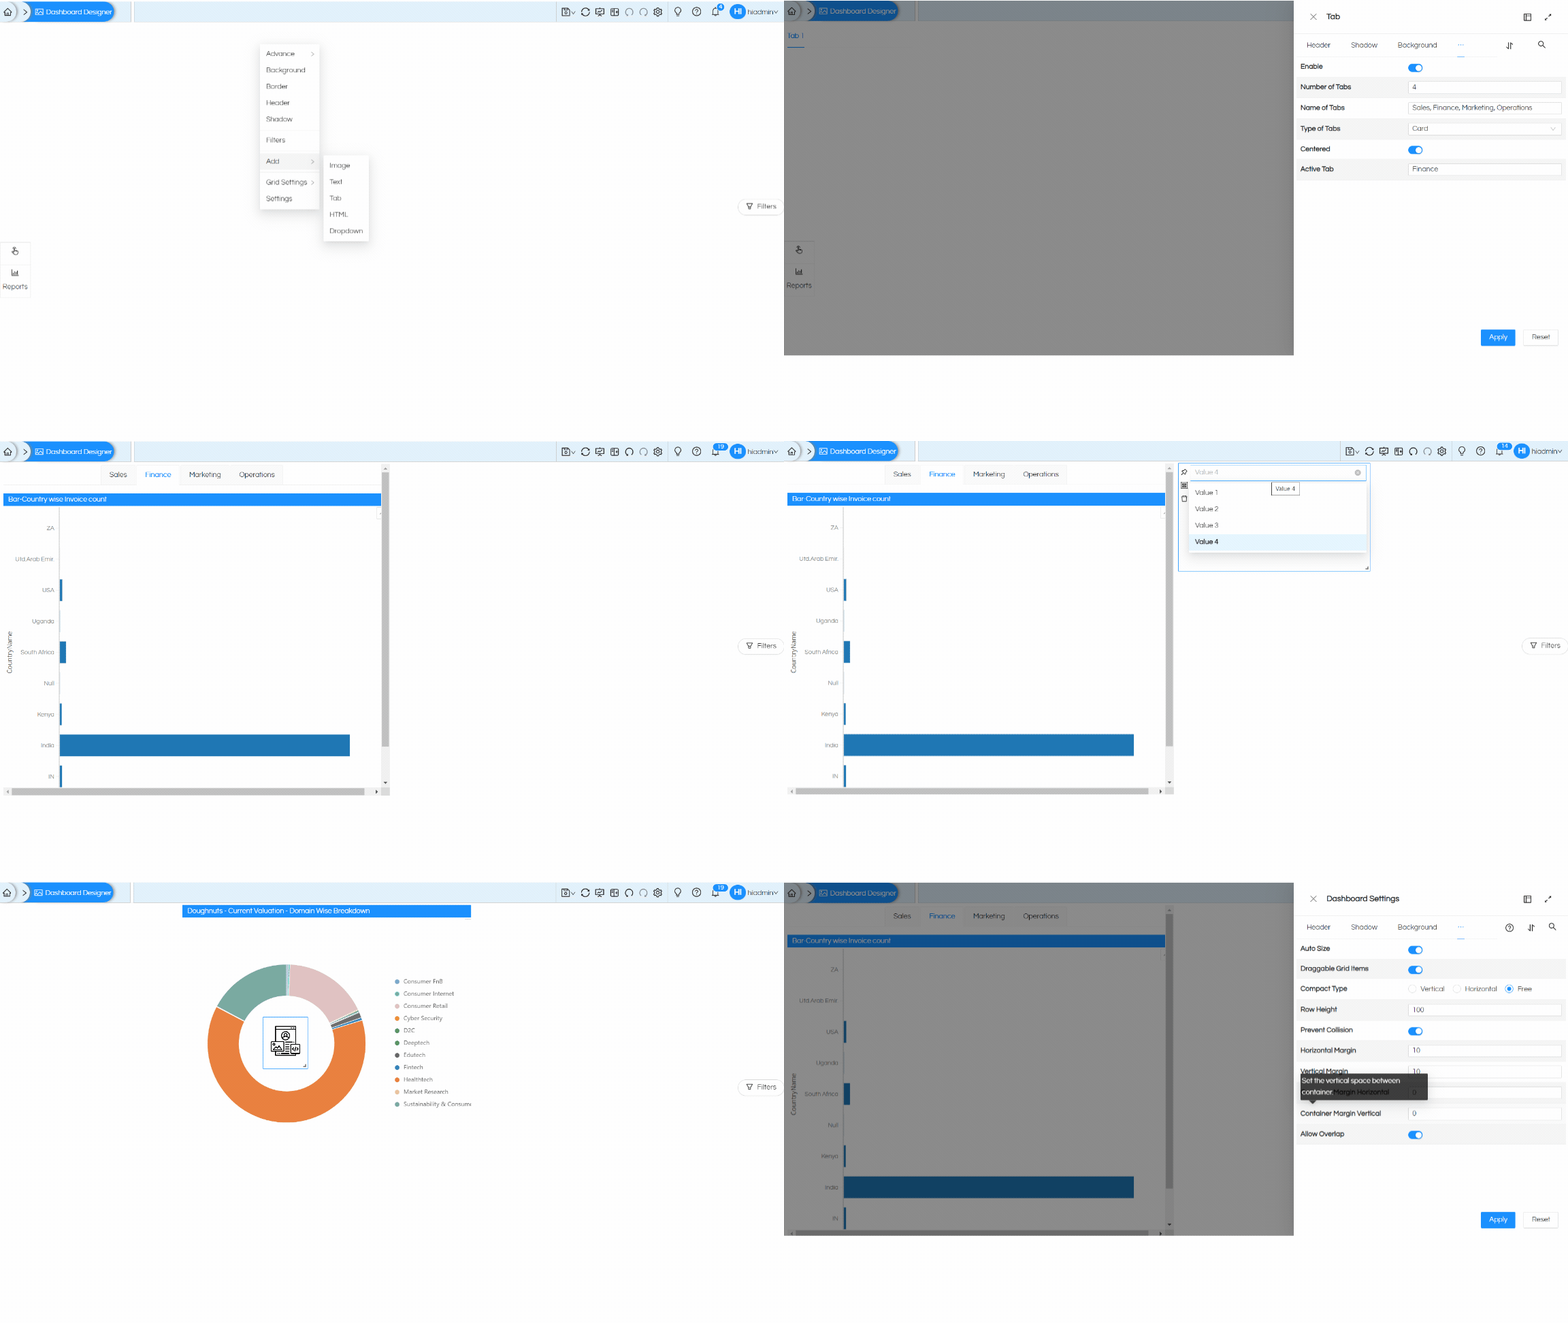
- Tabbed View support: Tabbed view support can allow to create Tabs and reports, images, text, groups etc can be put into those tabs. This is useful when displaying lot of reports in the dashboard. Tabbed view helps in easier categorization, cleaned interface as well as faster performance. Usage video
- Filter variables access: From version 5.2.1 we have introduced filters variables access. Hence it is possible to create custom buttons / events etc, and based on those clicks dashboard filters values can be changed. Read more about it here.
- Overlays: Overlays functionality introduced from version 5.2.1 can allow you to put components on top of each other. This can go a long way in having pixel perfect alignment, customizing the look and feel and creating aesthetically good looking dashboards. Usage video
- Custom HTML Component: A new functionality which has been added is a custom HTML component, just like images and text. Now an HTML component can be added and put anywhere as well as resized. All right click operations are applicable to this component also like Header, Shadow, Background Color, Border etc. Inside that HTML component, HTML content or other code can be written.
- Drop down: An option to add custom drop down is added which can be put anywhere in the dashboard. Drop down values can be specified and custom actions can be specified which should happen when those drop down values are selected.
- Margins: Any component added now it is possible to specify the margins which that component can have. This can be useful in removing white/empty spaces, adding white/empty spaces.
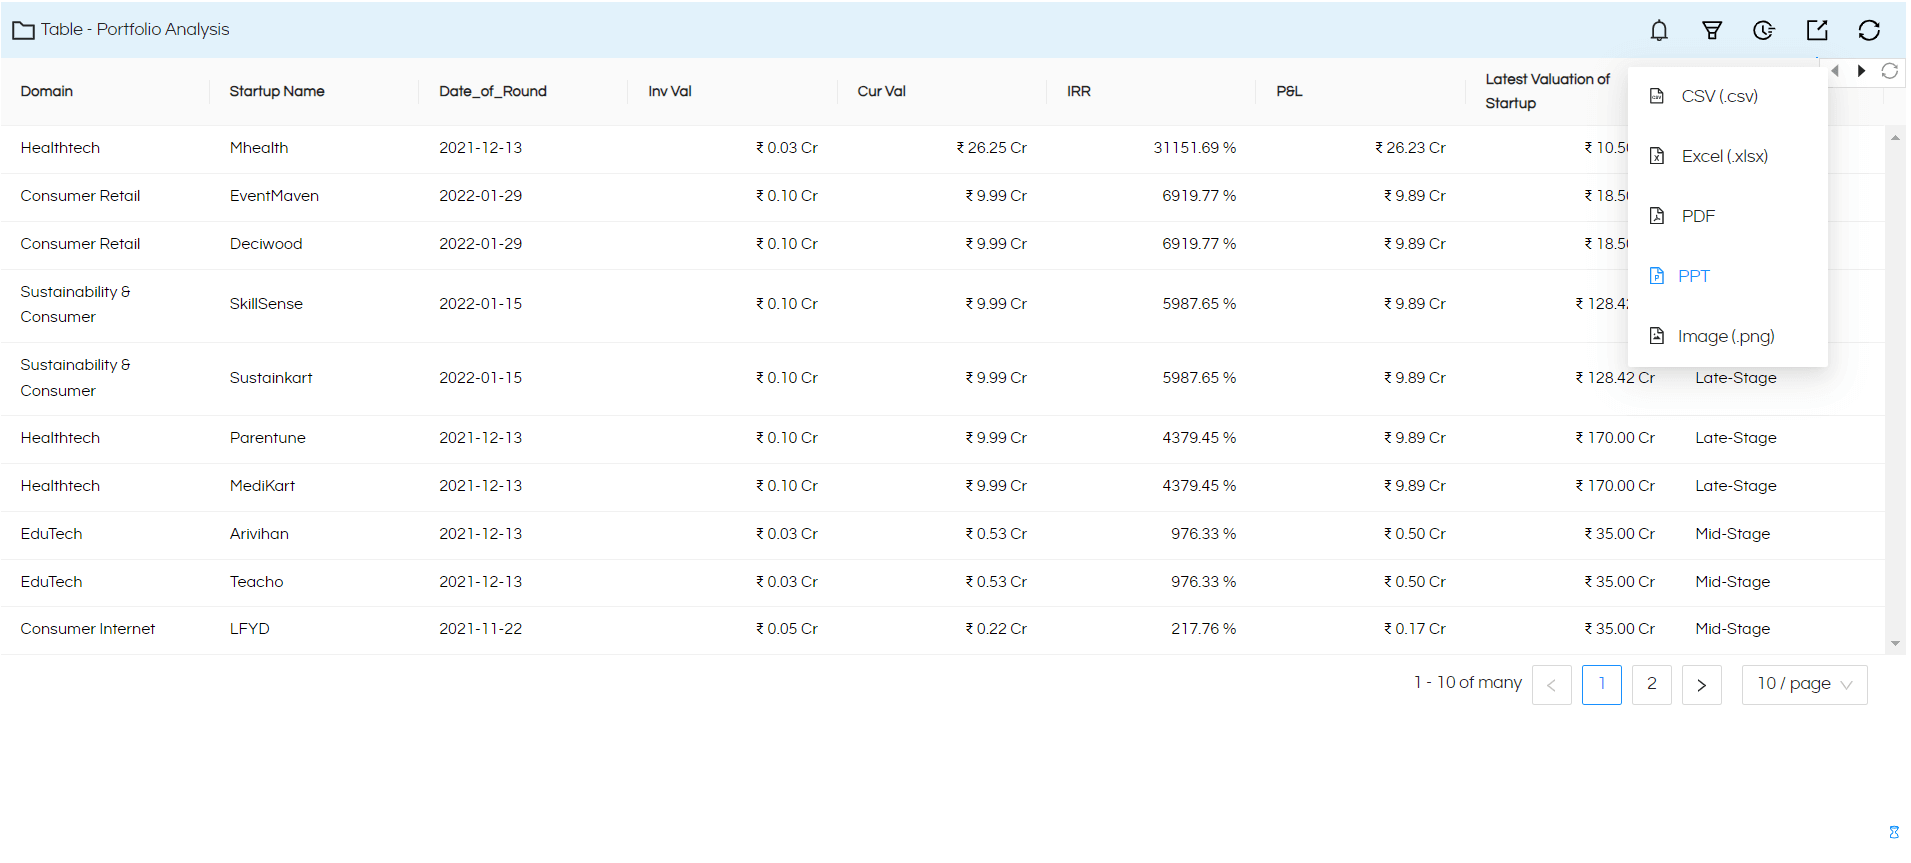
- EXPORT :Version 5.2.1 onwards, few new more exporting options have been introduced in Beta. These include PPT and Image options.
- Dashboard Designer: Dashboard designer has undersgone lot of enhancements from version 5.2.1 allowing many more options, functionalities and controls.
Please reach out to us on support@helicalinsight.com in case of any support, demo, POC as well as migration help from your current costly technology stack. We can also help in prioritizing and building any custom features which you might need.
