Jan’2025: We are happy to inform about releasing Open Source BI product Helical Insight version 5.2.2 (5.2.0.1473 GA). In this blog we are going to talk about what all are the new features which have been added as compared to version 5.2.1
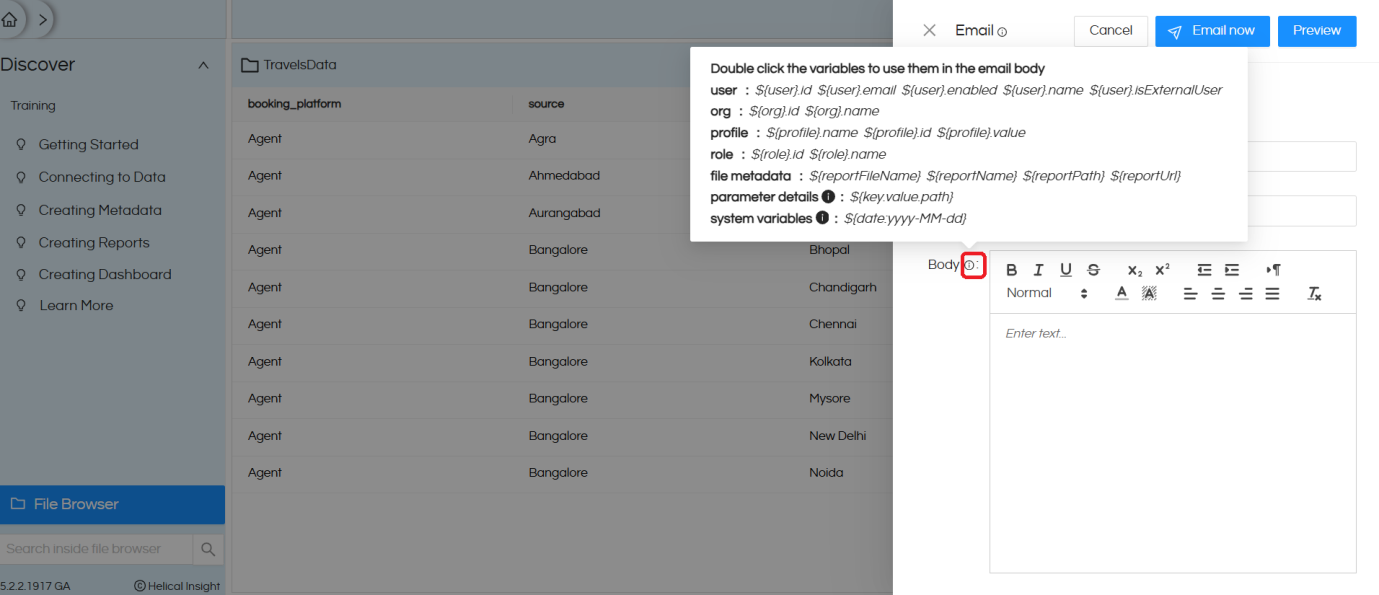
A. Email / Email scheduling enhancement: Version 5.2.2. now allows access to various kind of dynamic variables which can be used in the Subject, Body and To field while doing emailing or email scheduling.
These variables include things like Date / Date time, Filter name and filter value, Report/dashboard name, user/role/organization/profile details etc. Click here to read more about this functionality.
Some use cases includes:
- Sending the report name and filter value along with email scheduling
- Sending the current date and time while scheduling
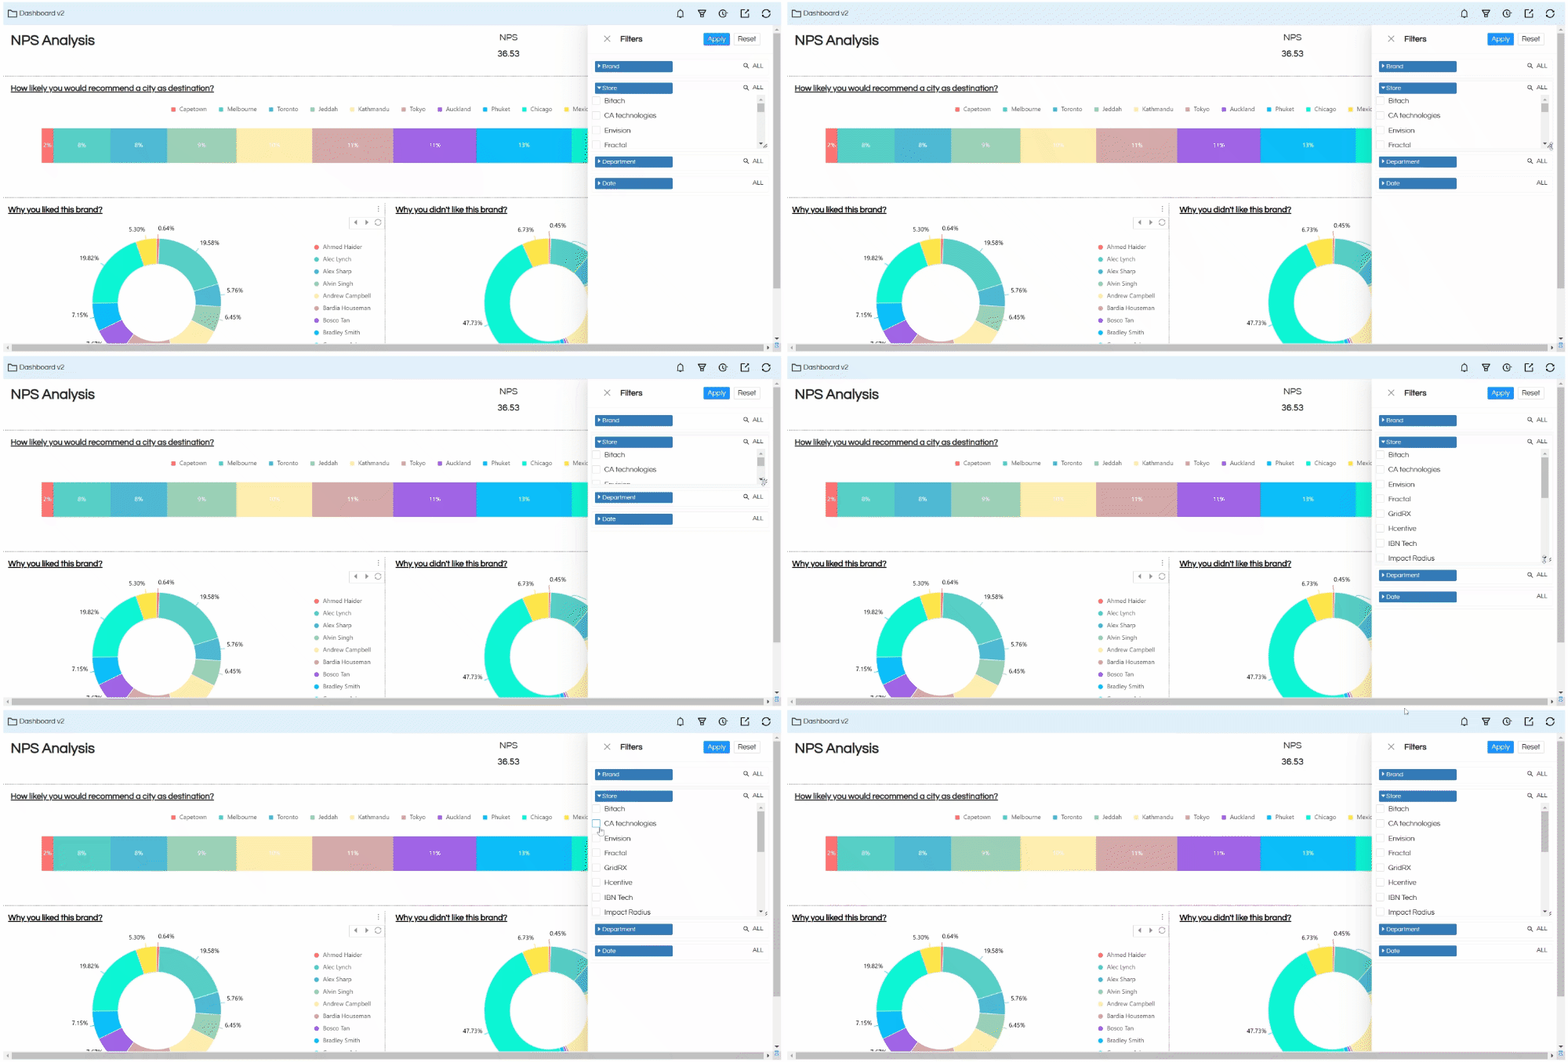
B. FILTER: Performance improvement at filters: With version 5.2.2 we have made enhancements at the filtering level and there has been a substantial more than 85 % improvement in performance. This performance is linked to the listing of the filters values and those values selection. This is applicable both at the report level and dashboard designer level.
C. FILTER: Filter Usage Improvement: For a person to select the value of a filter, an option is introduced allowing them to increase size of the area wherein the values of the filter is visible. This is especially useful when the number of values in the filter is more and thus improving overall user experience of the filters usage.
D. Session less Embedding: More and more product based companies and client of our’s are opting for embedding of advanced analytics of Helical Insight directly within their product. Keeping these things in mind, we have introduced a new method called as Sessionless Embedding method (apart from already support other methods). The session less embedding helps with improved performance, more enhanced security and other benefits.
Read here to learn more. https://www.helicalinsight.com/sessionless-embedding-in-helical-insight-version-5-0-onwards/
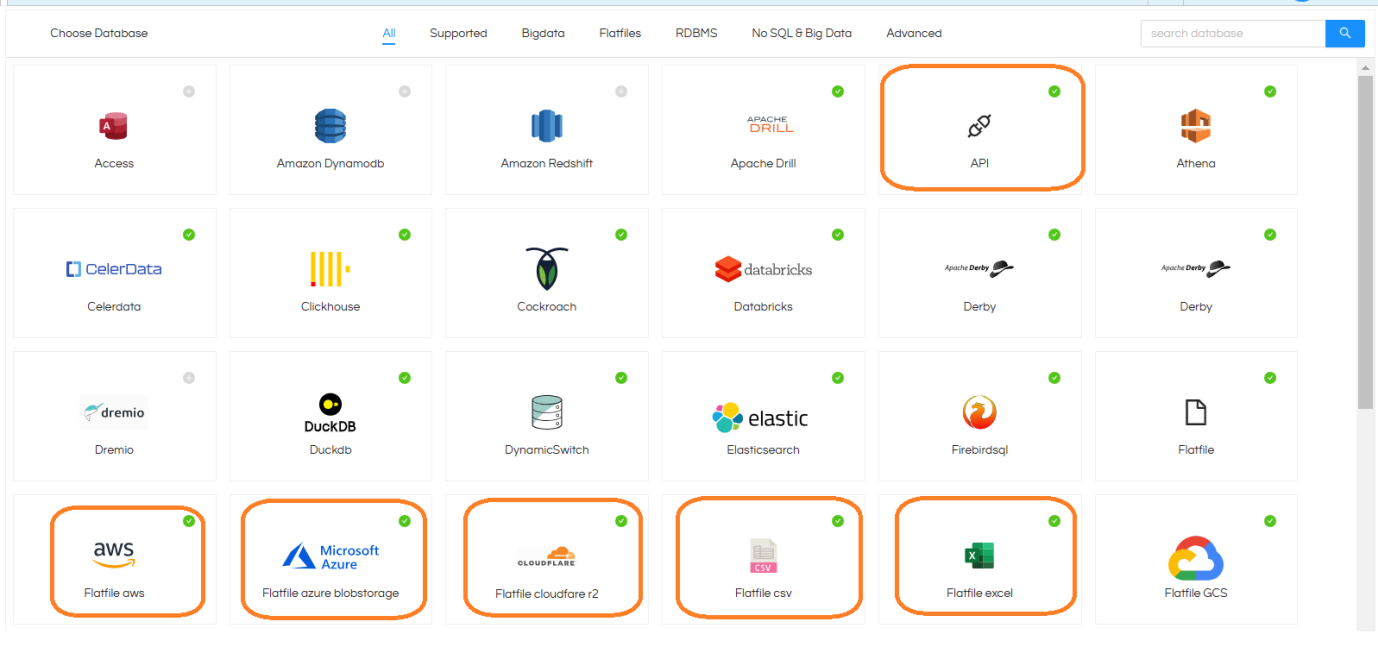
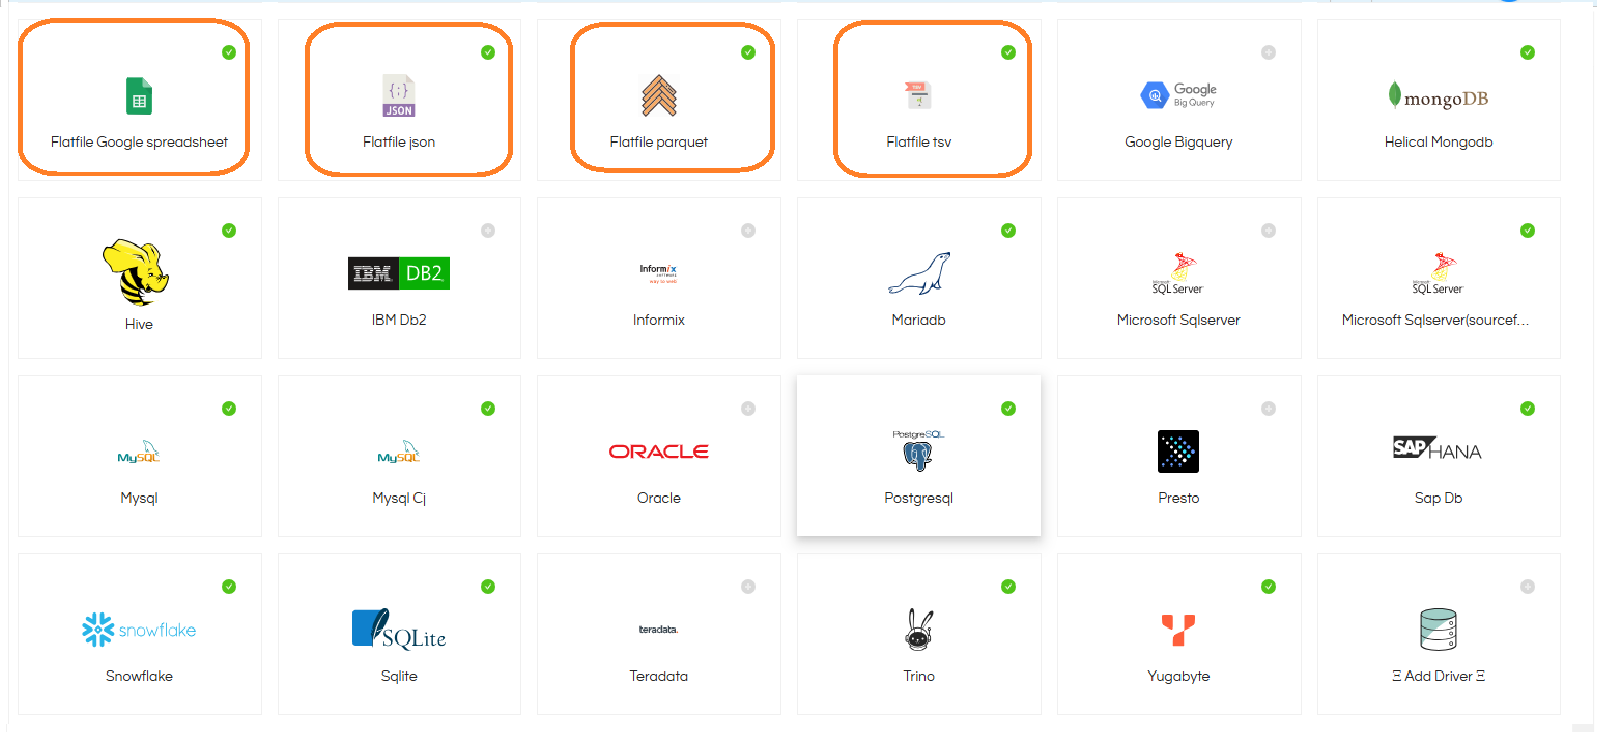
E. DataSource Layer: In version 5.2.1 we had introduced support for flat files, JSON and Rest API. Major bug fixing and enhancements have been done in that. Now from the UI itself you can upload those flat files like CSV, Excel, JSON etc as well as from the UI itself you can provide the required configuration details. A huge list of configuration options are present which can be used.
- API Direct Support: https://www.helicalinsight.com/connect-and-use-an-api-as-a-data-source-in-helical-insight-5-0/
- CSV Direct Support: https://www.helicalinsight.com/usage-of-flat-filescsv-in-helical-insight/
- Excel direct support: https://www.helicalinsight.com/usage-of-flat-files-excel-in-helical-insight/
- JSON Direct support: https://www.helicalinsight.com/usage-of-flat-filesjson-in-helical-insight/
- Google Sheet direct support: https://www.helicalinsight.com/usage-of-flat-files-google-spreadsheet-in-helical-insight/
F. New charts customization options: With every new version, we continue to add more and more charts customization options allowing more control and flexibility to end users while they are creating and using Open Source BI Helical Insight
- Custom column usage as Measures: In version 5.2.1 we had introduced a new functionality allowing to use any measures as a custom measure name and custom measure value. From version 5.2.2 even custom columns can also be dragged and used. Read more here.
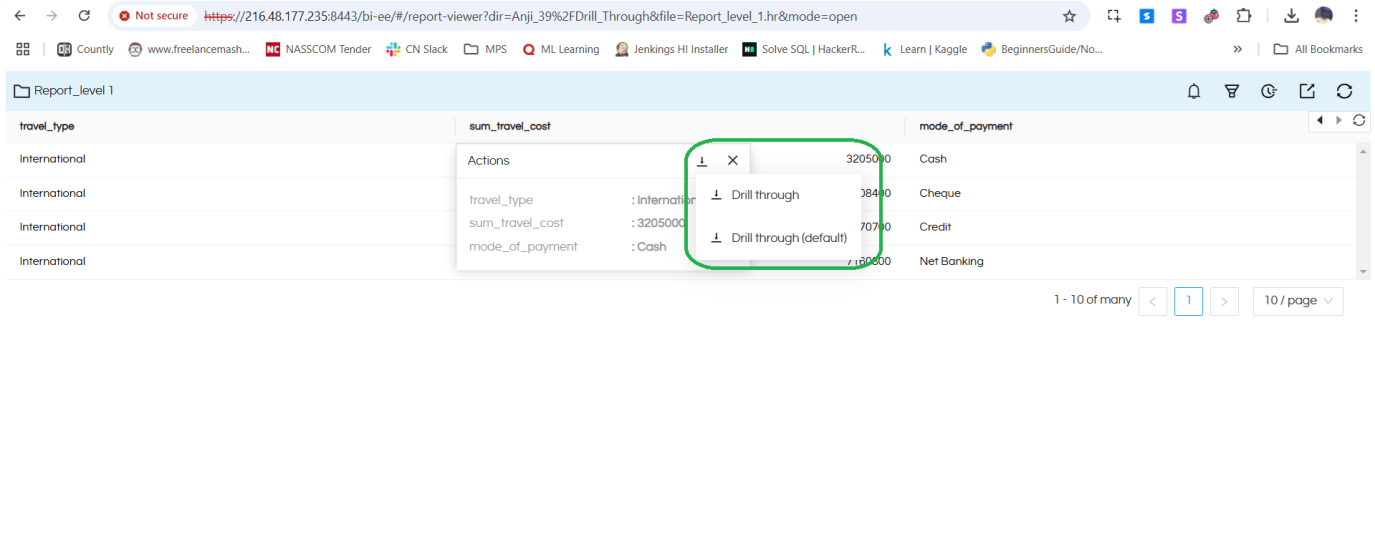
- Drill through enhancement: Till now, the drill through always used to show drill through with limited data only based on the on-click event. But there were certain requests wherein users wanted an option to be able to see the drill through child report with full data. A new option is introduced which allows you to either drill through with limited data or drill through with full data. This will work for any drill through either at report level or dashboard level.
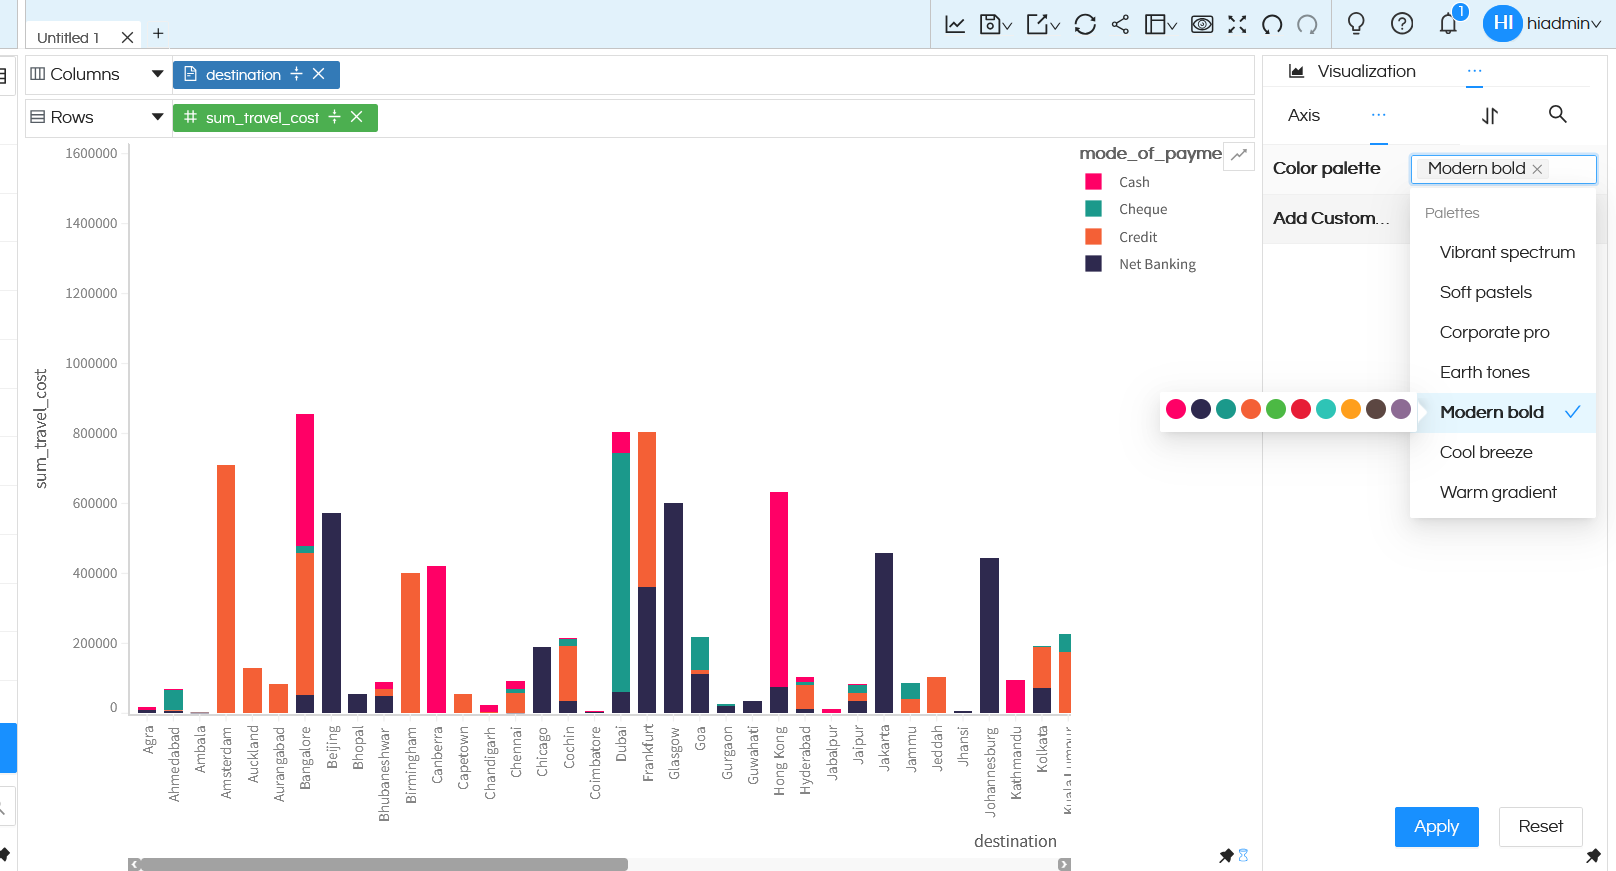
- Color Palette: This property can allow very quickly applying any of the color palettes and generating very beautiful charts with gorgeous color themes. There are more than 56 prebuilt color themes and it is also possible to add custom color palette also. Read more
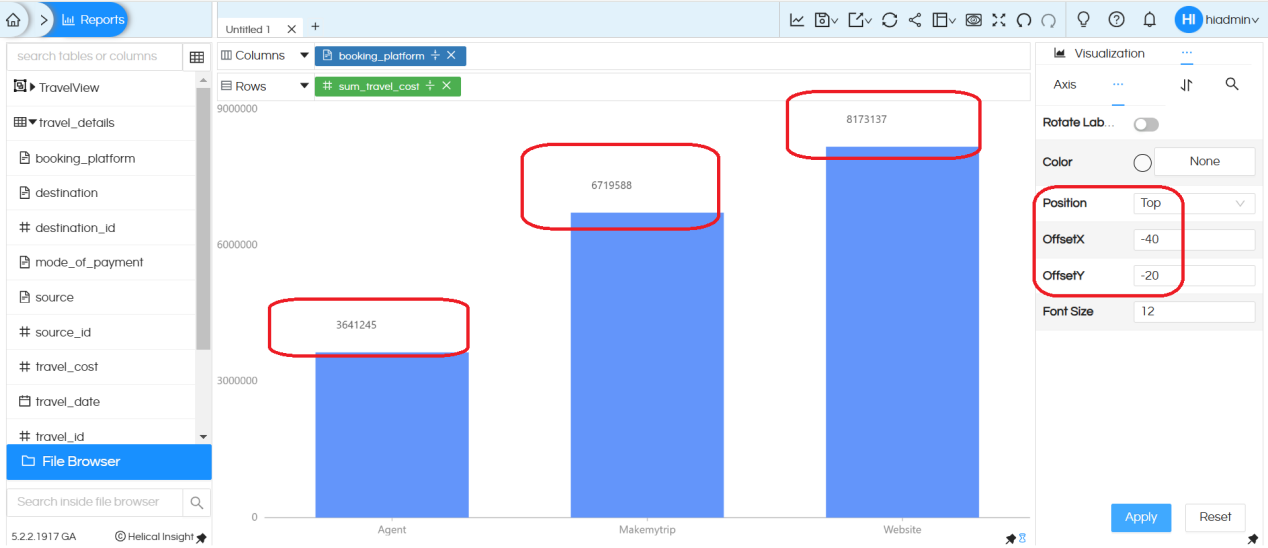
- Ability to show data label on top of bar chart. There are also newer options like offsetX and offsetY also added allowing more custom granular control of the position of the data labels. Read more
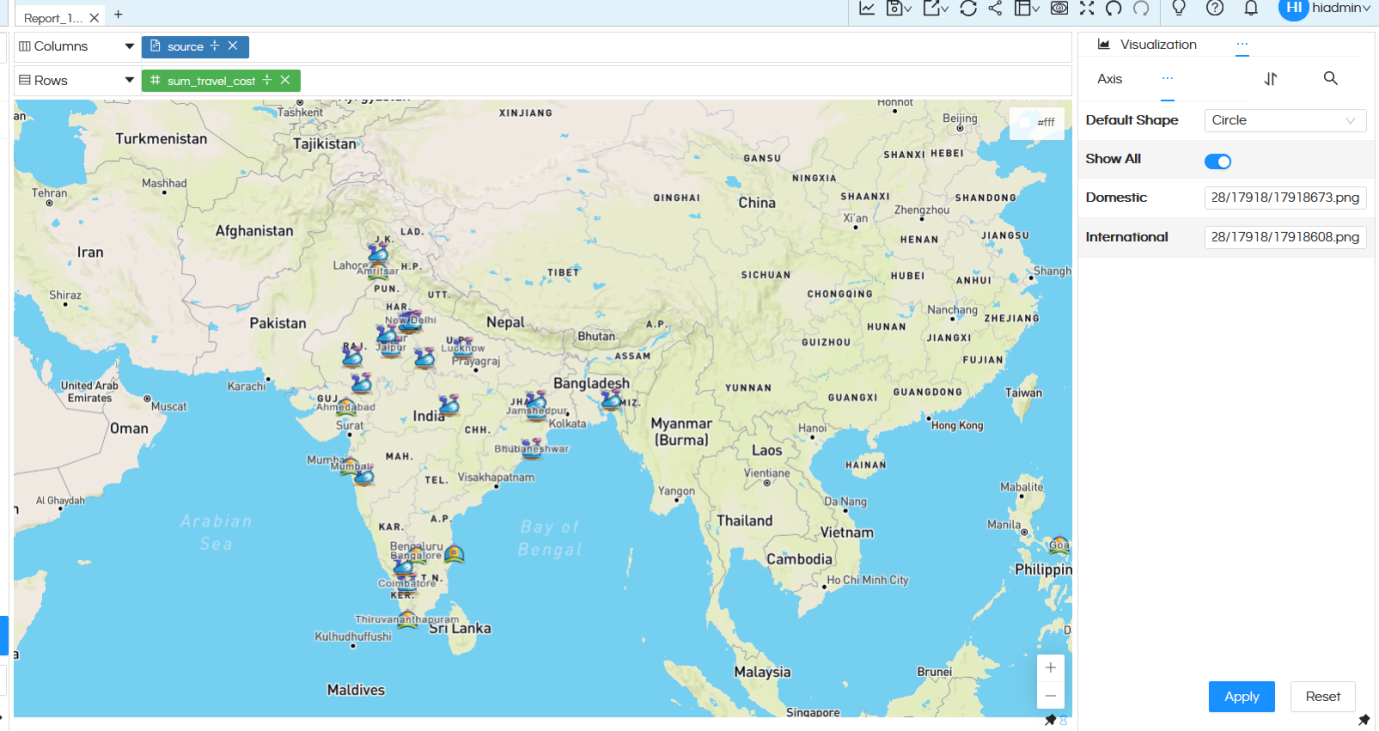
- Custom Map Icons: A new property is introduced allowing you many more prebuilt options for using as icons on top of Map. You even can upload icons and use any custom icon also not present in this list as icon on top of map. Read here.
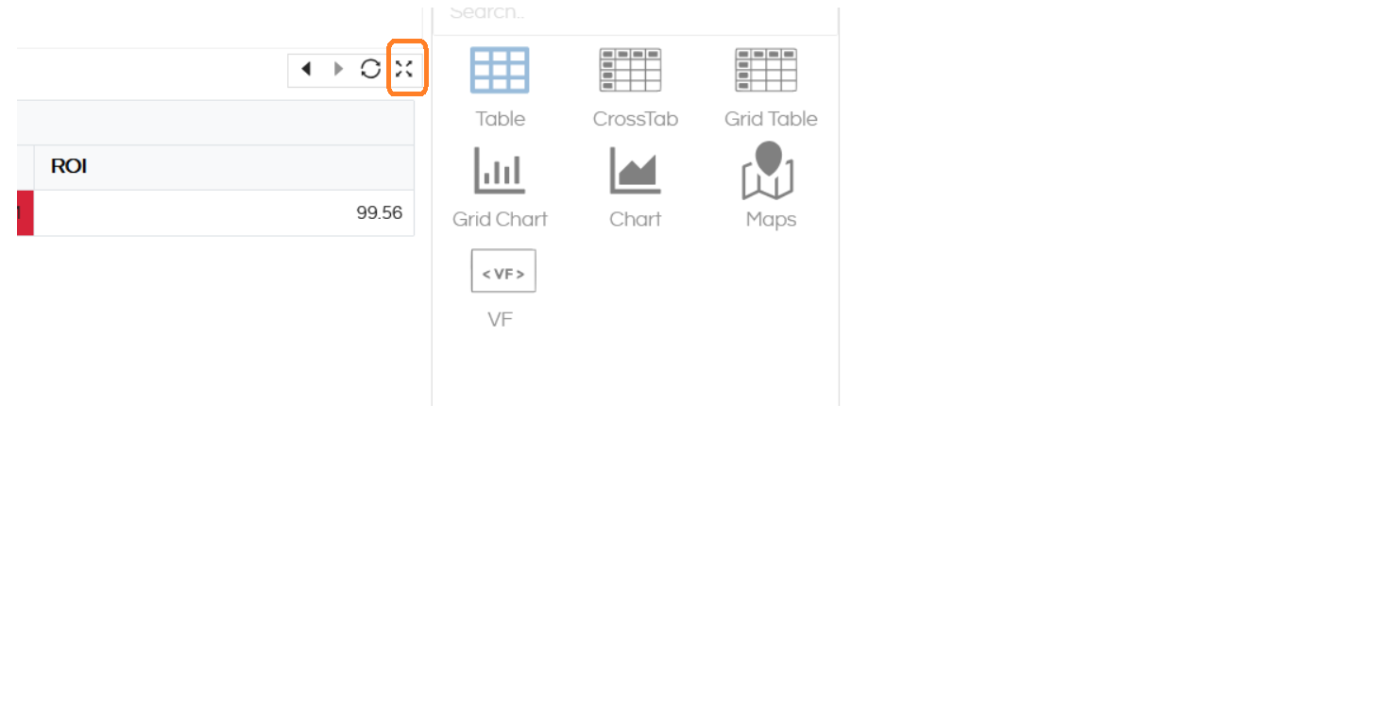
- Drill through Report Maximize Option: Drill through is a very important tool when using interactivity allowing users to open the detailed child report in the same frame. However in case if the parent report frame size is less, then the child report might not be clearly visible. Hence, a new option called maximize is also added allowing users to maximize the drill through child report. Read more here
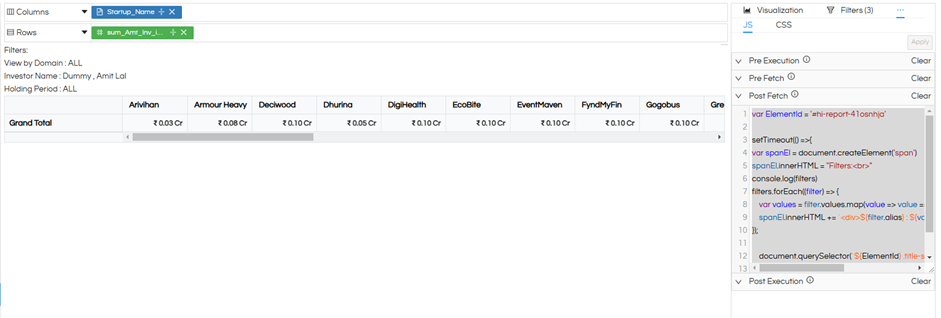
- Filter Value: A new method is introduced which allows to display the selected filter and it’s value even directly at the report level itself. This is especially useful when a user is directly consuming the reports and wants to see what filters have been applied. Read more here.
- Sub chart option: A new sub chart option is introduced which can allow you to zoom in zoom out. This is especially useful when you have more data and you would like to zoom in zoom out option allowing you to see some specific area in more detail.
Read more here. - Pie and Donut Chart additional Options: Based on the feedbacks received from users, we have introduced few more options in pie chart and donut chart. This allows users to show multiple things on the labels which includes value, labels and percentage via one click option. This is applicable to both “Grid Charts” and “Charts”


G. Dashboard Designer: Below we are listing the new set of feature additions which are added in the dashboard designer.
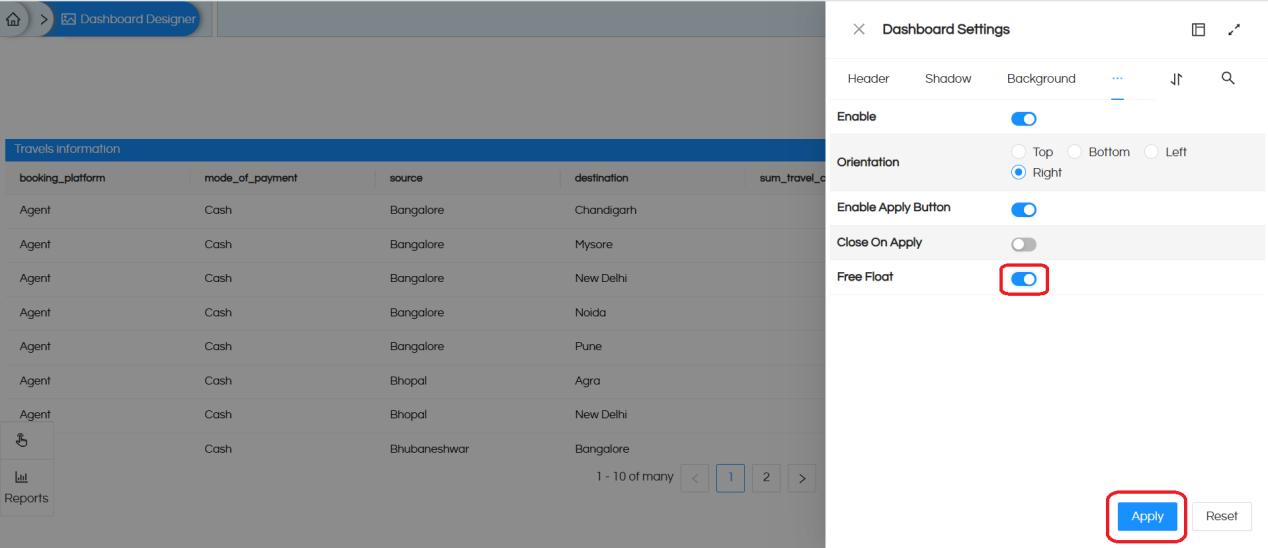
- Free Float Filter Component: Till now the filters used to come as a popup from side (left side, right side, top or bottom). From version 5.2.2. onwards of Open Source BI Helical Insight, we have introduced a free float component for the filters. This can allow you to keep the filters anywhere in the dashboard as well at any position. You can also right click on the added filter and perform all the right click operations (like customizing header, shadow, border, background color, add HTML CSS JS etc). Read more here
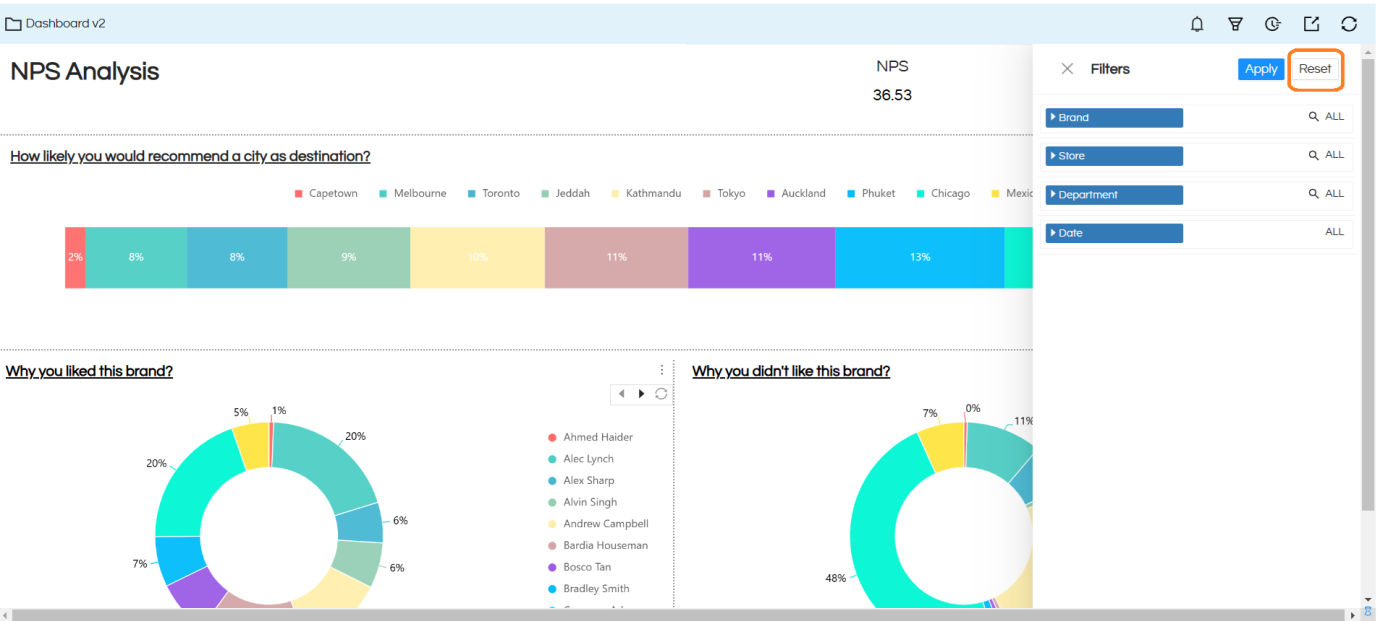
- Reset Option: Now the added filters are also having Reset button option. This can allow you to reset the values of the selected filters and see the dashboard in it’s default state.
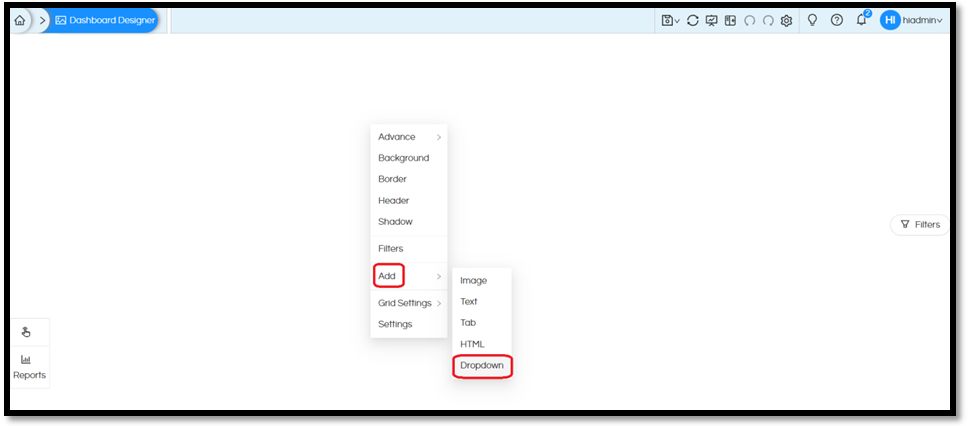
- Dropdown component addition: A new functionality is introduced allowing you to create a custom dropdown and the values which it will have. Based on the values which are selected, you can trigger other set of actions. Like displaying or hiding some reports/components, change the value of filters etc. Read more here.
- Change Report: From version 5.2.2 a new option has been introduced in the dashboard designer. In certain cases you have put a report in the dashboard, given it certain set of styling look and feel etc. But later you would like to change and would want some other report to come at that place. For those cases this functionality is useful. Clicking on that will open the file browser, allowing you to change the report. This is also useful in case if you want to create certain dashboard with lot of styling etc as template. Then new dashboards can be created using this template by simply switching the reports.
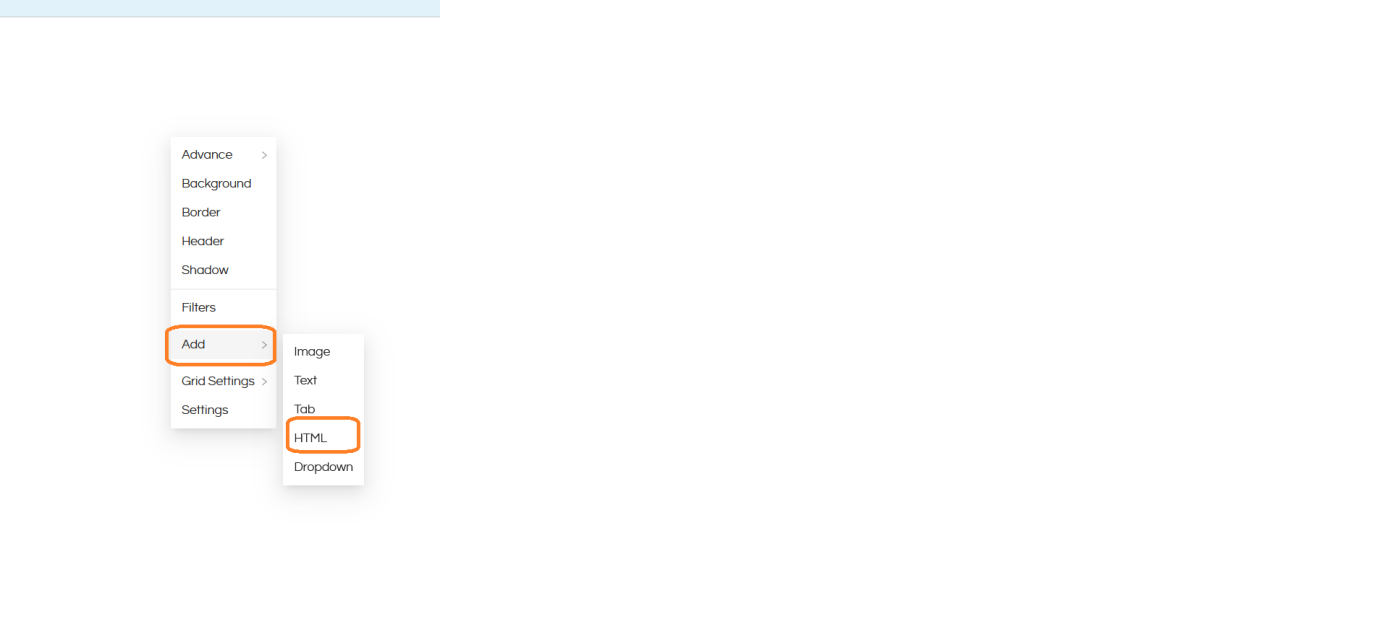
- HTML Addon: On the right click Add option, there is a HTML component also which got added. So any custom HTML code can be added, and then that HTML component can be resized and placed anywhere that you would like. Any other kind of right click operations are also applicable here. This functionality is more useful in case of more custom requirements.
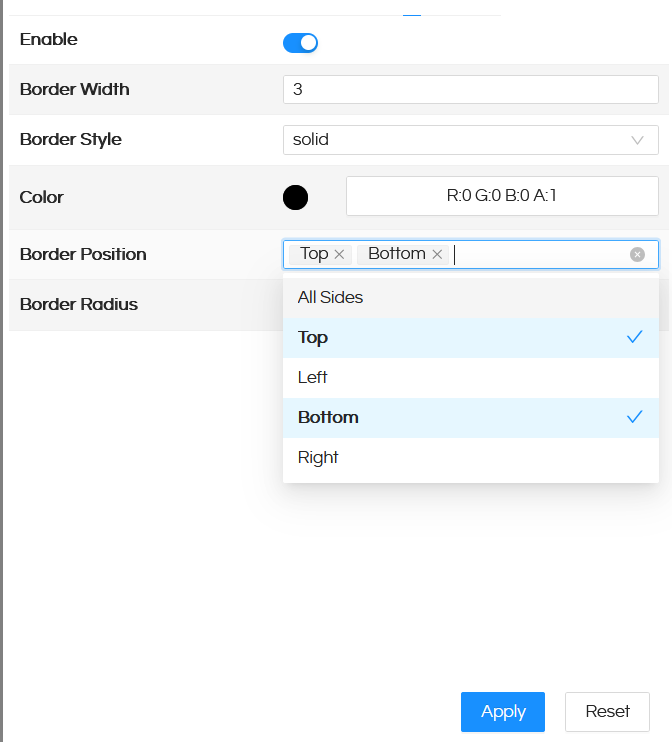
- Border Property – MultiSelect Option Enable: In dashboard designer via right click you can configure the border properties like it’s size, color, style etc. Earlier you can select where this border will get applied like Top, Bottom, Left, Right or All. Now you can multiselect. For example, you can set properties for Top and Bottom etc (multi select).
- Text and Image properties via JS: Via right click operations, it is always possible to add a text component or image component. From the version 5.2.2 onwards, the properties of the added text and image is now accessible via JS also. can also be edited and configured using JS also. Properties like below. Read more here.

properties.image.enable = true;
properties.image.imageRepeat = "initial";
properties.image.imageSize = "fill";
properties.image.opacity = 30;
properties.image.url = "<Image URL>";

properties.text.enable = true;
properties.text.link = "";
properties.text.text = "";
properties.text.text = "<strong>hello</strong>"  // bold text
properties.text.text = "<em>hello</em>"  // emphasized text
properties.text.text = "<u>hello</u>"  // underline text
properties.text.text = "<s>hello</s>" // text with a strikethrough or a line through it
properties.text.text = "<sub>hello</sub>" // subscript text
properties.text.text = "<sup>hello</sup>" // superscript text
properties.text.text = "<h1>hello</h1>"  // heading 1 (largest size)
properties.text.text = "<h2>hello</h2>"  // heading 2
properties.text.text = "<h3>hello</h3>"  // heading 3
properties.text.text = "<h4>hello</h4>"  // heading 4
properties.text.text = "<h5>hello</h5>"  // heading 5
properties.text.text = "<h6>hello</h6>"  // heading 6 (smallest size)
properties.text.text = "<p>hello</p>"  // normal heading size
H. Bug Fixing: Some of the known bugs at the report designer and properties level, dashboard designer level, cut copy paste have been fixed.
Please reach out on support@helicalinsight.com in case of any questions, POC, demo or further questions. Register and download for free from here.
