We are releasing Open Source BI product Helical Insight version 5.2 (5.2.0.1473 GA) in May 2024. In this blog we are going to talk about what all are the new features which have been added as compared to version 5.1
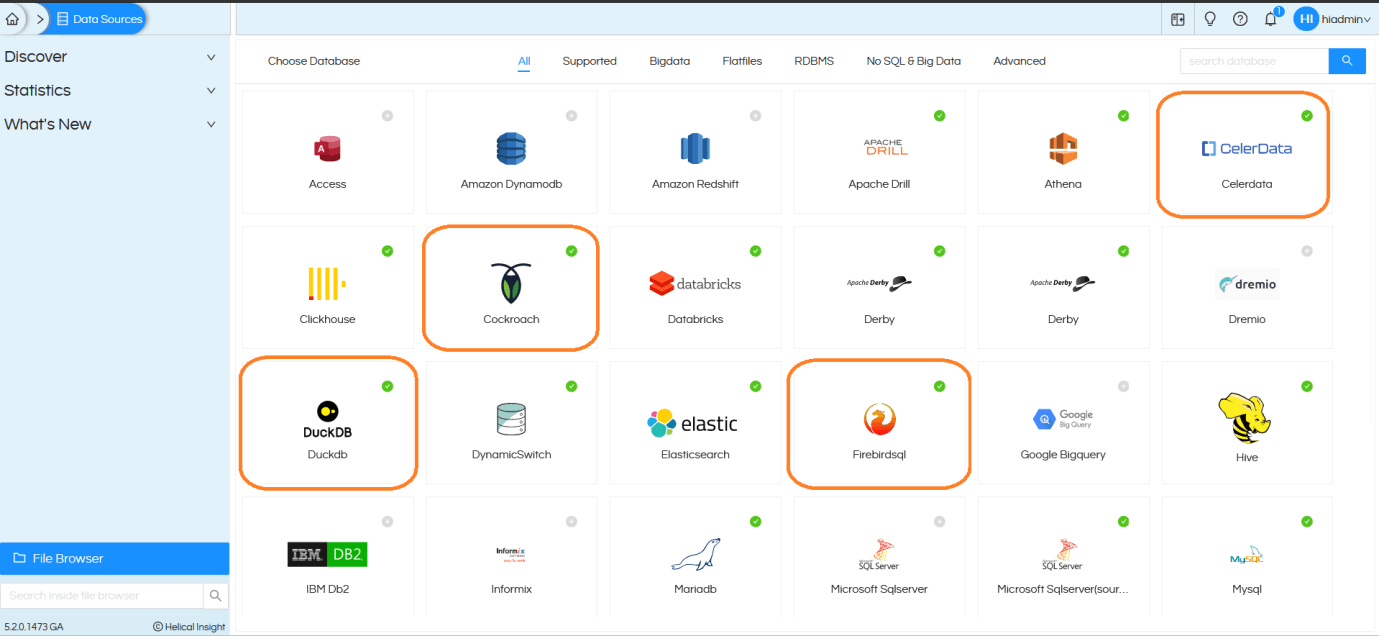
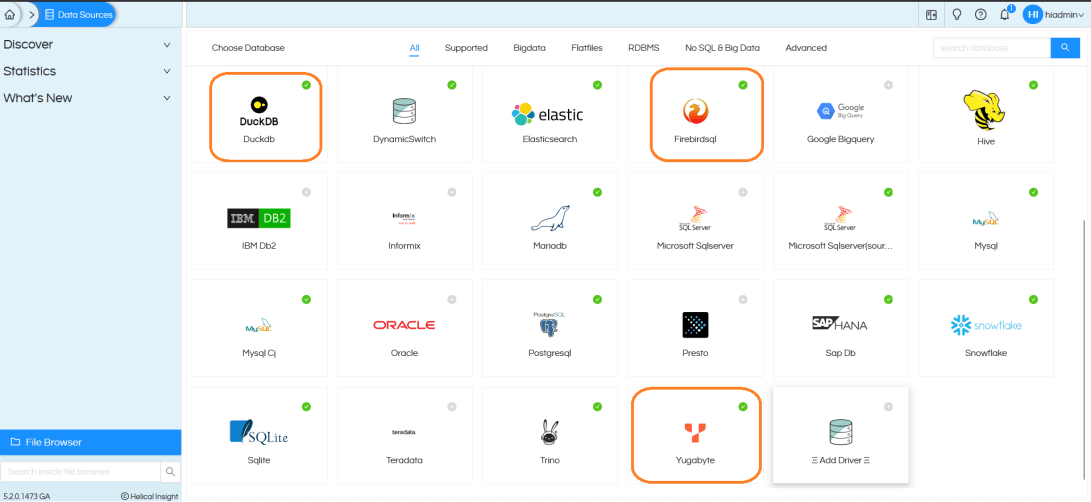
(i) New Database support: With every new version of Helical Insight, we continue to add more and more support of databases directly out of the box. We are extremely proud that from version 5.2 onwards we have added support of the 6 more below mentioned databases directly.
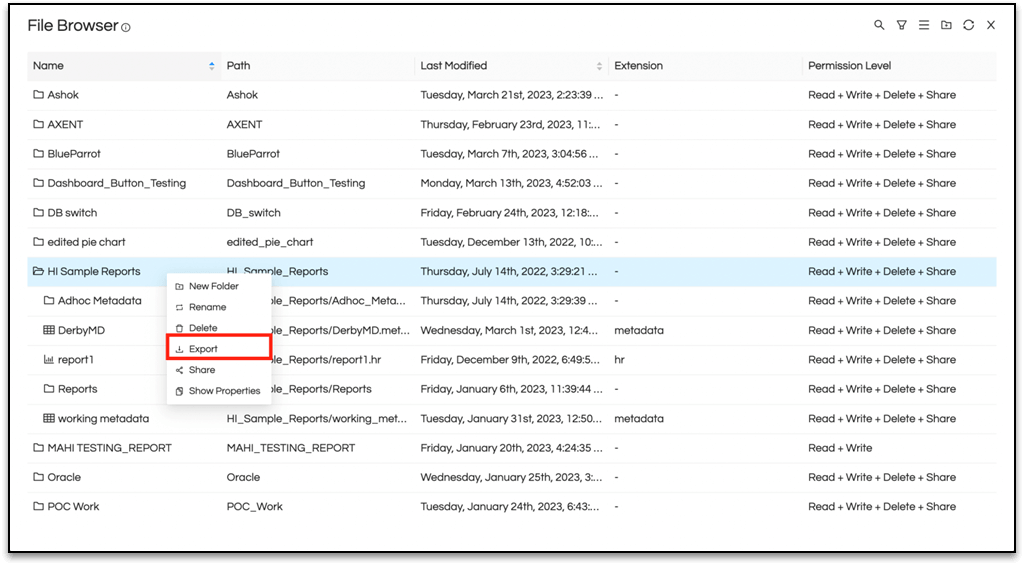
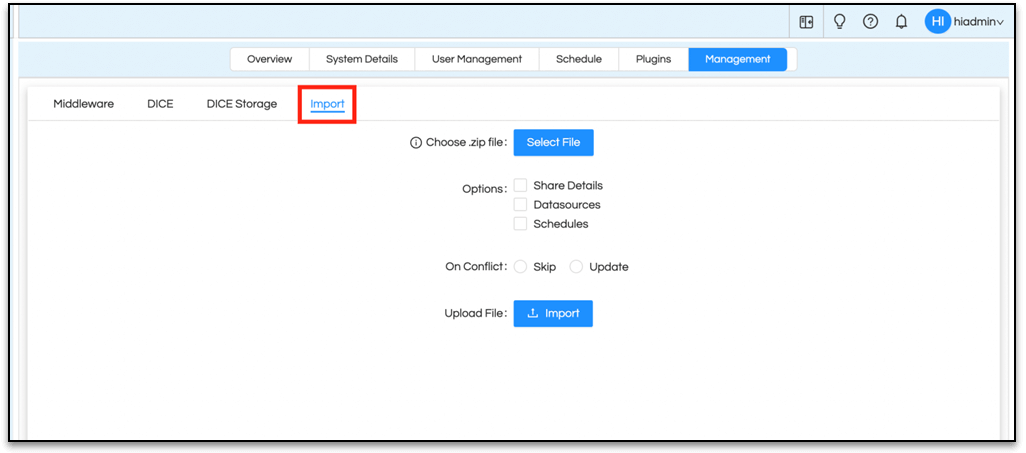
(ii) Import Export: We have added options of import export which can allow you to move files from one server to another server with import export utility options. There are options which can allow you to import export specific folder or entire file browser and importing into another location.
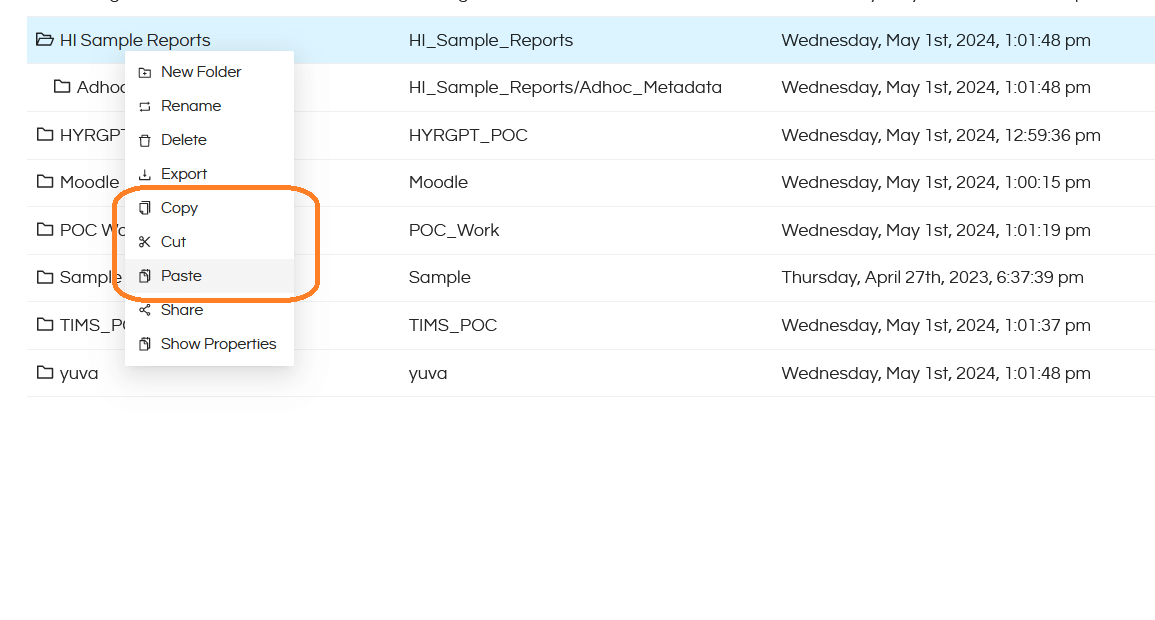
(iii) Cut / Copy / Paste: Just like we have cut copy paste operations in Windows, similar concept has been introduced in Helical Insight file browser. Now you can cut or copy resources (files/folders) from one location in file browser and paste in another location in file browser. You can read more about it here.
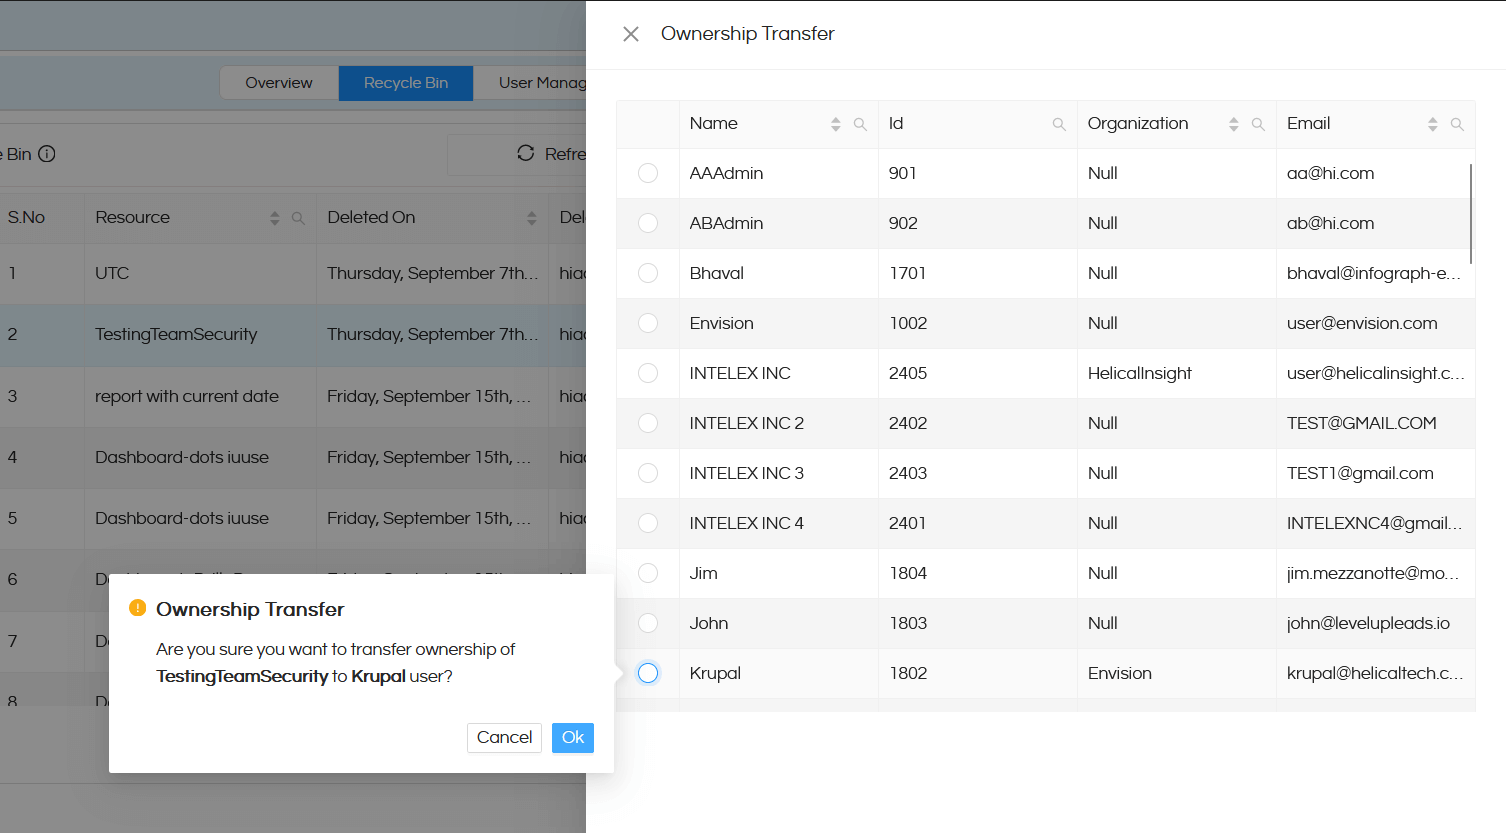
(iv) Recycle Bin: Introduction of recycle bin (similar to Windows) can allow an admin to recover any accidentally deleted resources (like datasource, report, dashboard, folder, user etc) or permanently delete it or recover any resource while changing the ownership level. You can read more about it here.

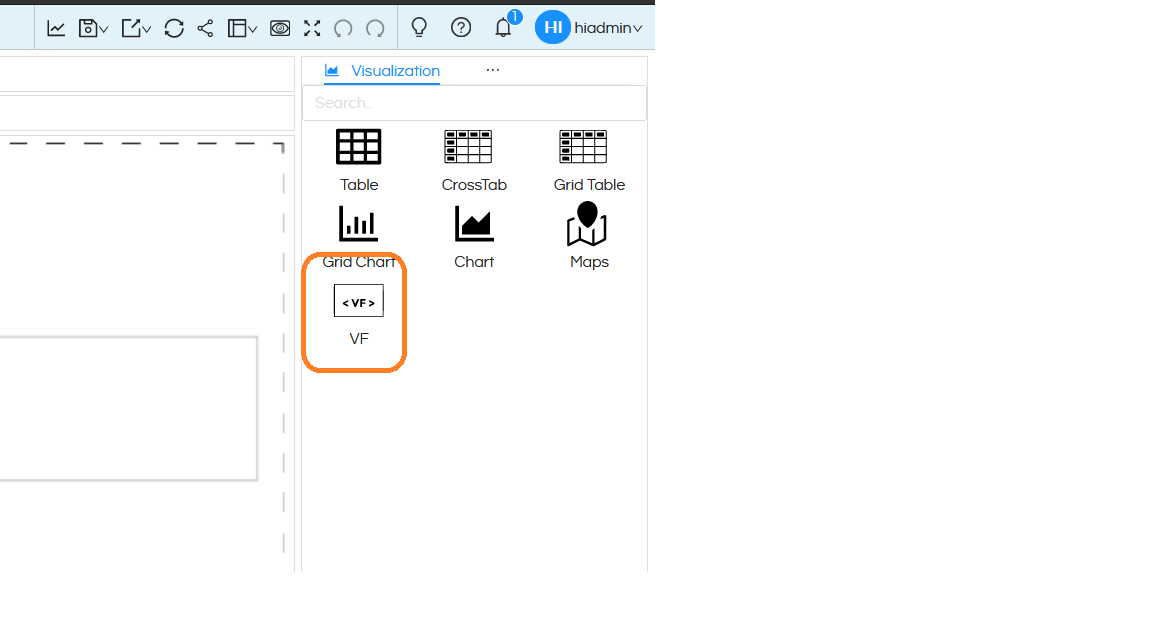
(v) Support of external JS visualization: With version 5.2 we have introduced concept of VF.
This will allow you to integrate and use any external JS visualization of AntD charts, muzeJS charts. Hence even if some visualization is not supported by default, it can be made to work within Helical Insight with this dynamic feature.
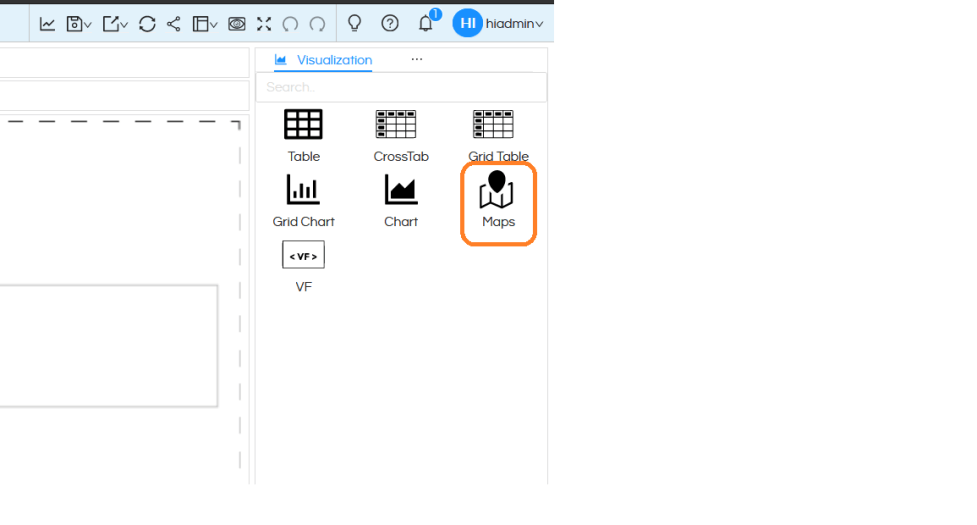
(vi) Support of Maps: With version 5.2, we have also introduced maps. Hence, it is possible to create and use Maps also within Helical Insight along with a lot of different kind of customization options. Mapbox support has been provided. Map supports all the options like drill down, drill through, exporting, inter panel communication as well as various marks options like color, size. Various other properties like color, formatting etc are as well supported.
(vii) New Customization Options: There have been support of additional customization options which includes
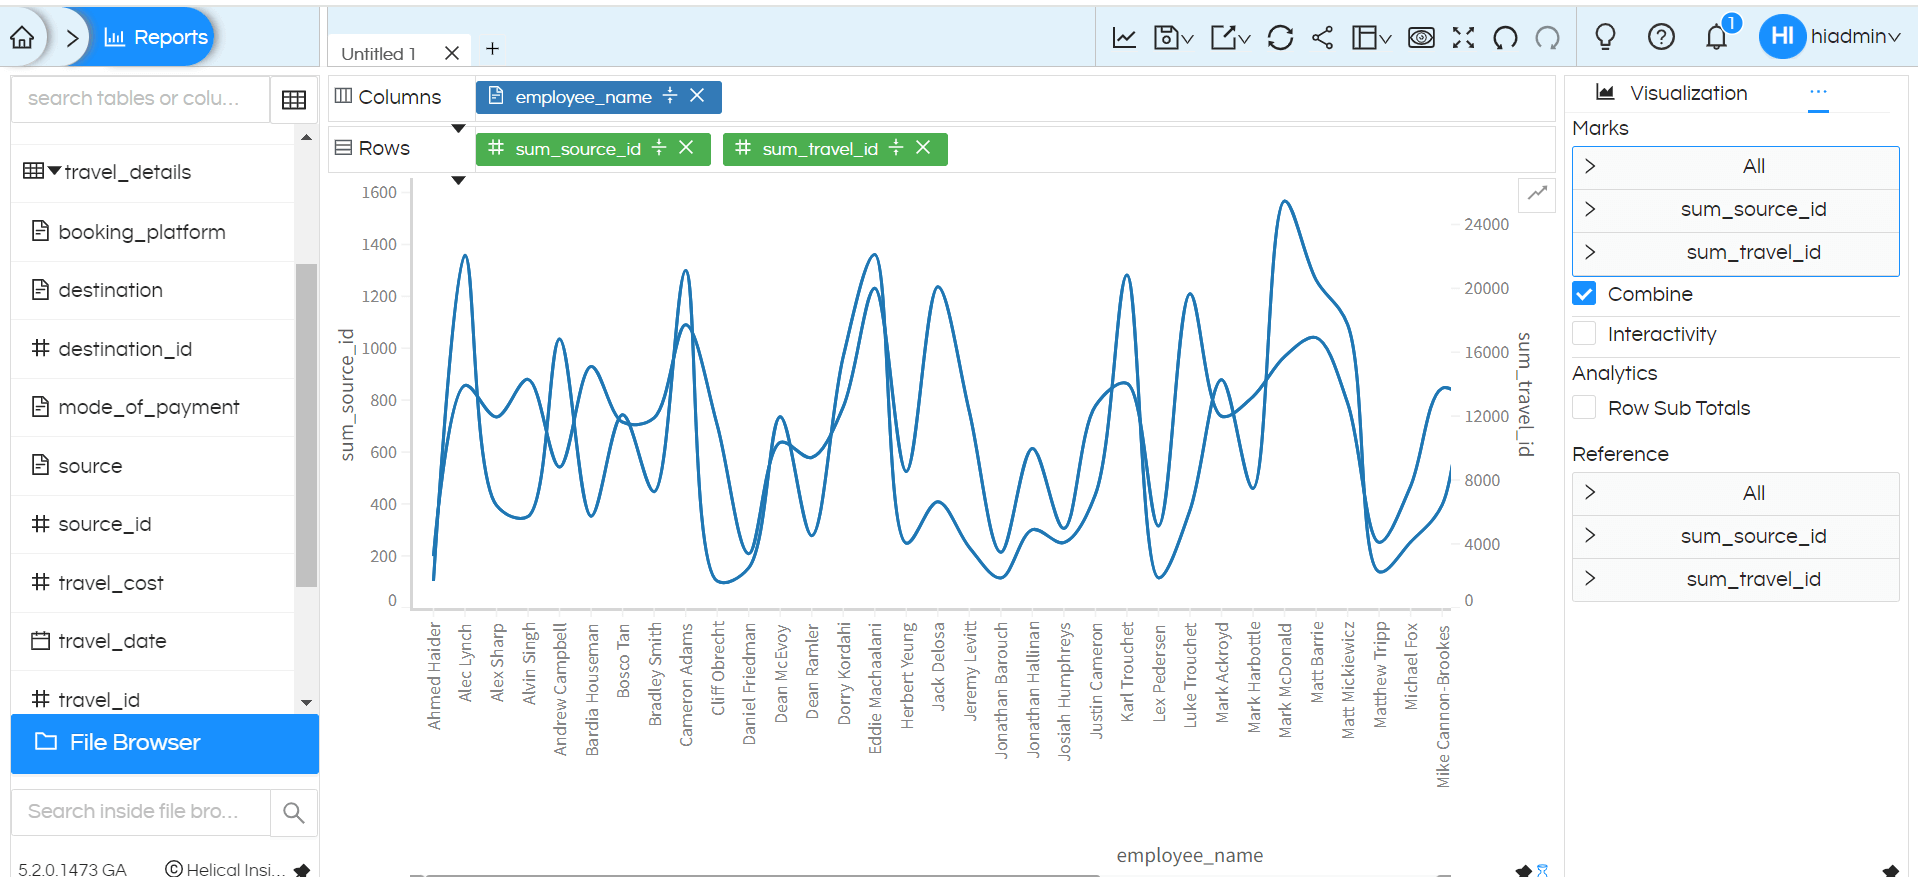
- Combine chart which can allow multiple measures in a grid chart sharing same axis
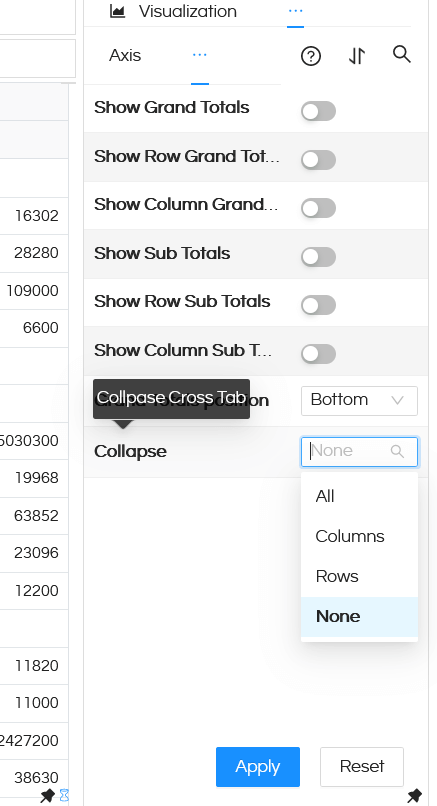
- Crosstab now supporting one more feature allowing to specify collapse/expand functionality / behaviour
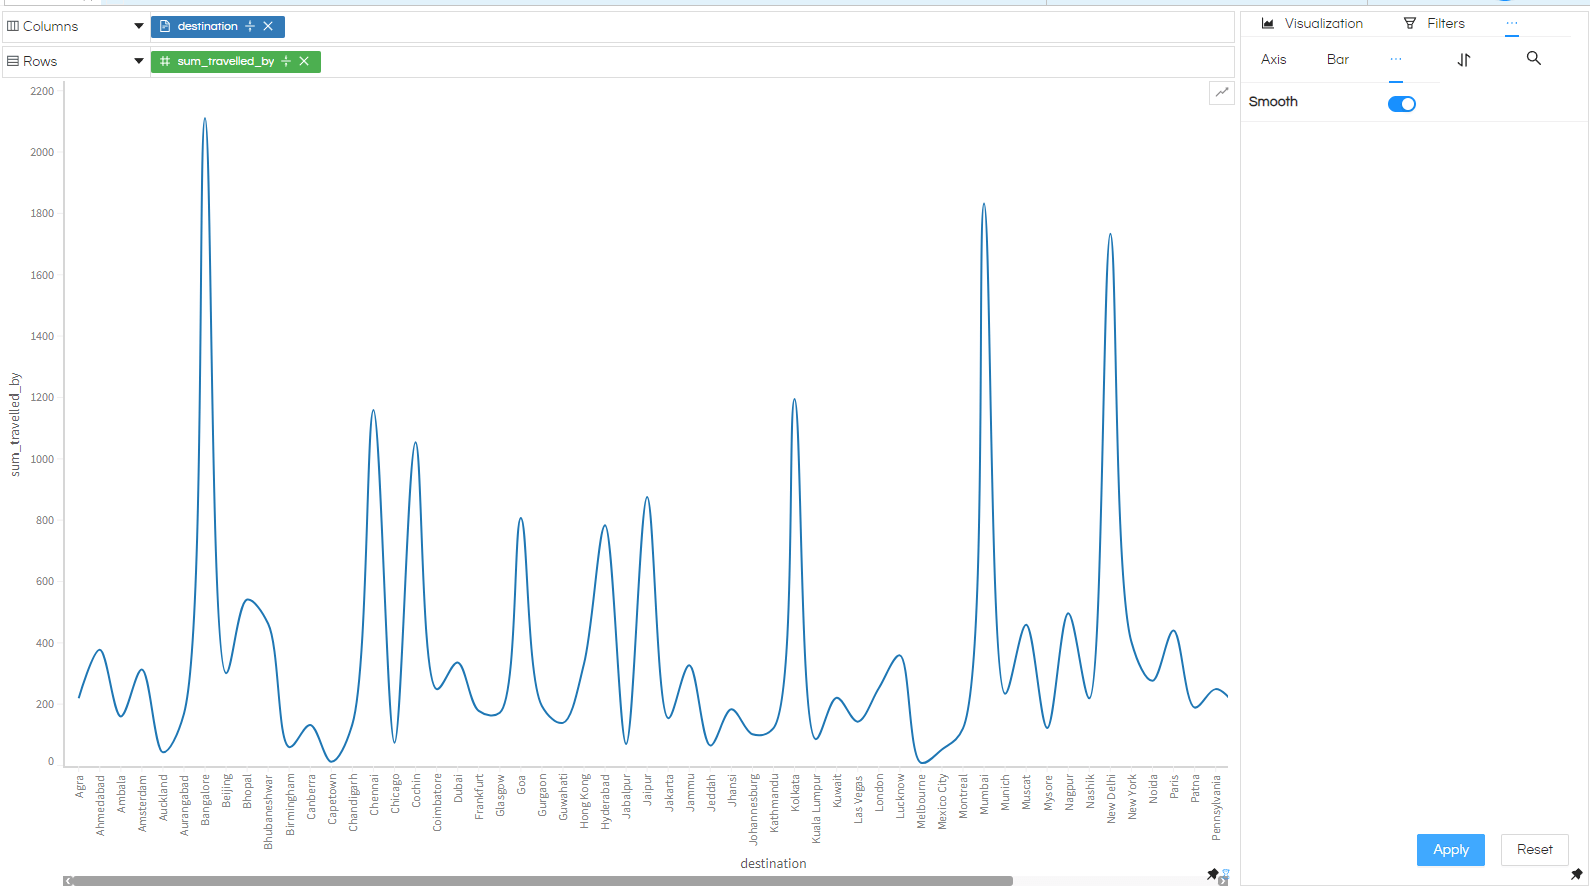
- A property of line chart which is smooth in nature. By default line chart which gets generated is having sharp edges
- Enhancements in relative date filtering as well as ability to pass relative date filtering in the URL of report/dashboard as well.
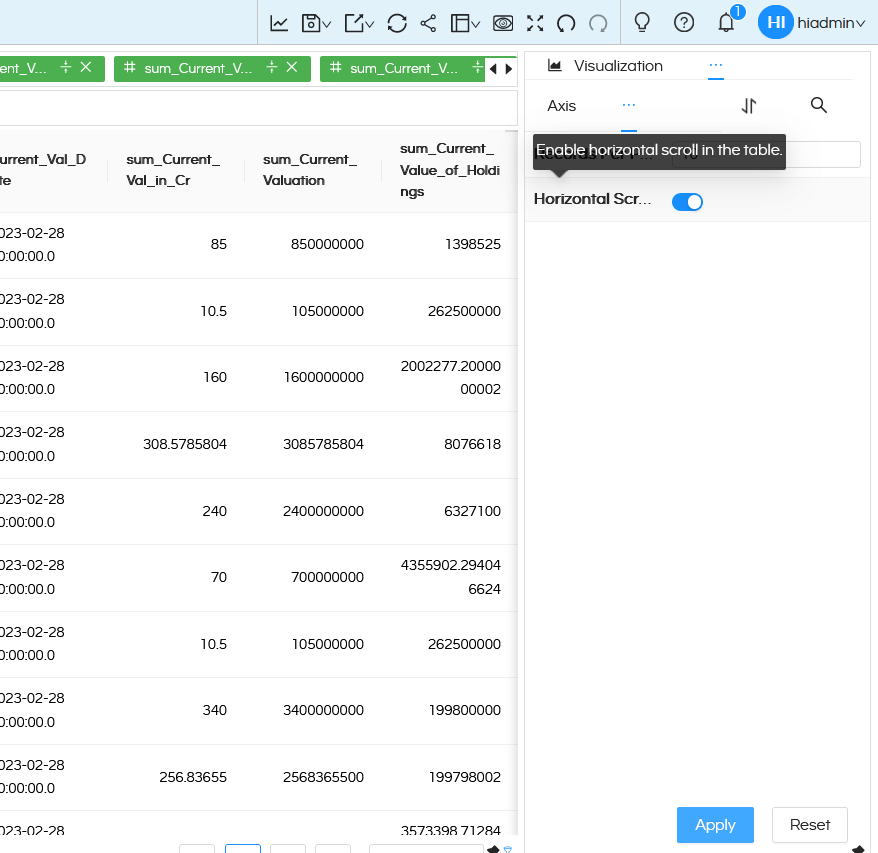
- A new property allowing to have’Horizontal scrollbar’ option inside Table property has been added. This is especially useful when you are adding lot of columns in a table because of which visibility of the tables gets affected.
(viii) Grid Table: Grid table has been introduced. This visualization is similar to crosstab or pivot view and it supports all the options like drill down, drill through, exporting, inter panel communication as well as various marks options like color, size. Various other properties like color, formatting etc are as well supported.
Please reach out on support@helicalinsight.com in case of any questions, POC, demo or further questions. Register and download for free from here.
What’s next?
We have a very strong product roadmap which includes
– GenerativeAI : We are working on integrating generativeAI capabilities into our product. Hence with this a lot of advanced adhocanalytics can be built using simple chat interface. This is especially useful if you would like to expose the possibility of allowing to build analytics to a much larger (and mainly non technical) audience.
– Addition of canned report module. This would allow to create pixel perfect multi-pager paginated kind of reports also. Examples of canned reports are P&L sheet, bank statements etc. We had support of canned reports till version 4.1, which we are again going to re-introduce.
– Tech upgrade: With the coming release, we are going to migrate to higher LTS version of Java and Tomcat.
– We will continue to support additional data sources as an ongoing activity
– Support of new charts and customization options as an ongoing activity
– Support of in-memory (akin extract) and cubes
– Directly supported advanced statistical and scientific algorithms
– UI-driven workflow method
– Data pipelines
