NOTE: From version 5.2.1 onwards, we have added one more property which allows to add “Total” at the centre of Donut chart. That part we will be covering towards the end of the blog.
NOTE: From version 5.2.2 we have also added some more options to display multiple things like label, value and percentage in the visible label. That part is covered towards the end.
This article show you to how to display percentage values on a pie chart. From RC2 i.e GIT830 build of version 5.0 we have even added an option of displaying percentage also which we would be explaining below. The steps described here will work for both arc/pie and donut chart of “Grid Charts” and “More Charts”
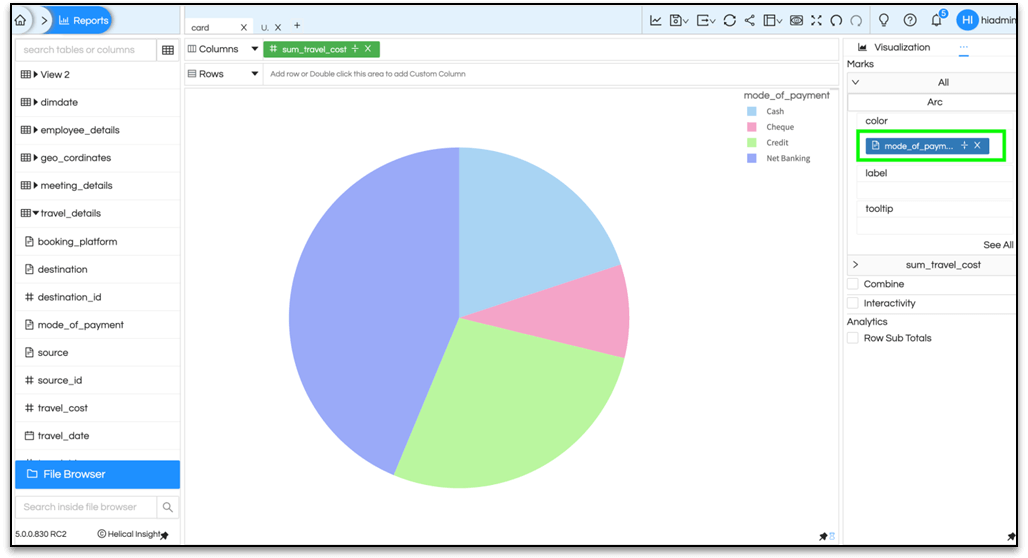
Step 1: Image 1 shows you a simple arc/pie chart showing sum_travel_cost with mode_of_payment in color section.
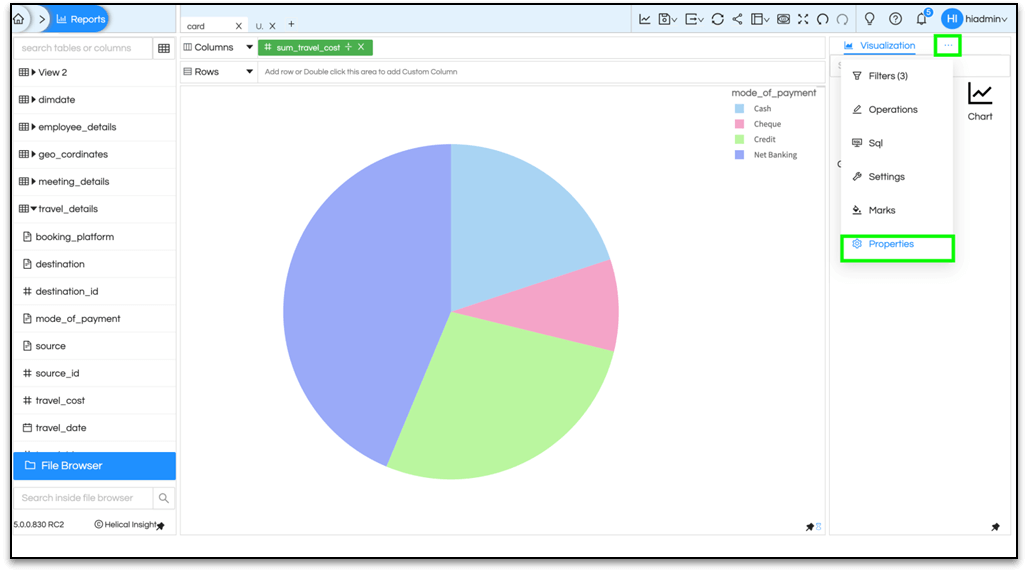
Step 2 :Hover over the meatball icon on top right and select Properties from the dropdown menu.
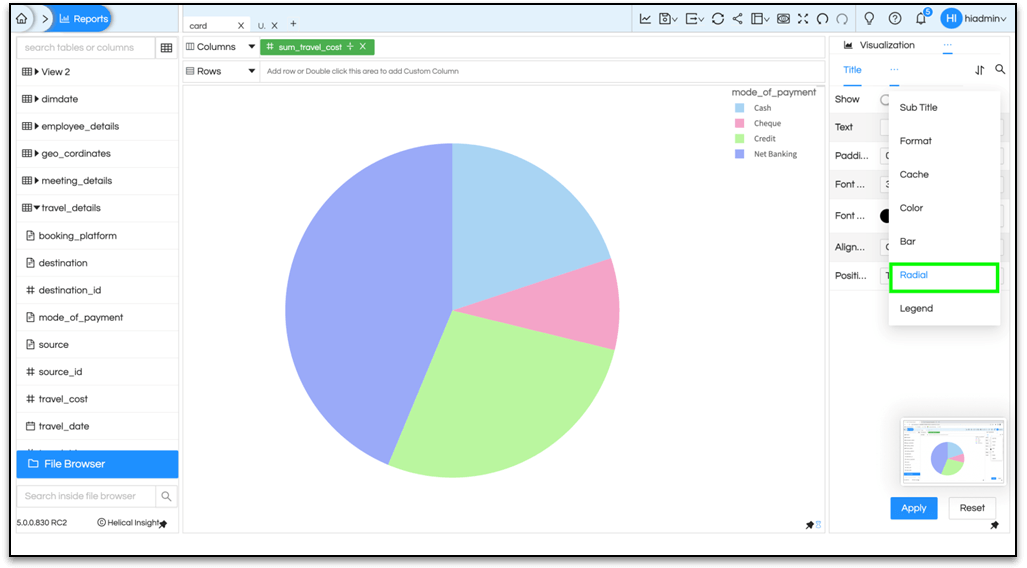
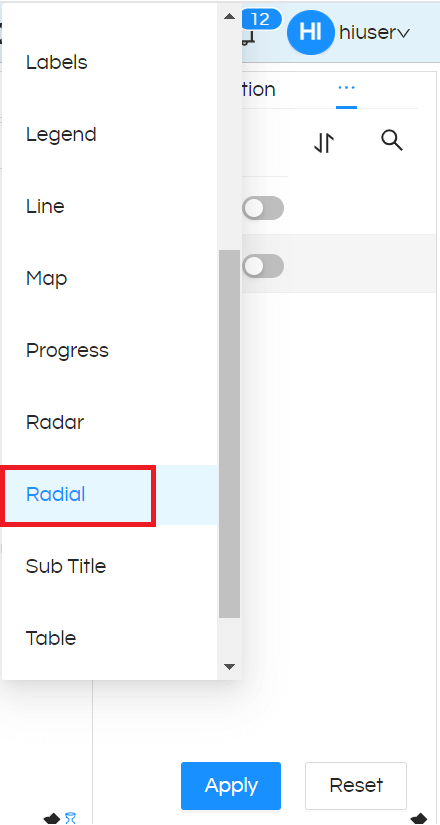
Step 3: A new pane will be seen. Again hover over the highlighted meatball icon (in the image below) and select Radial option.
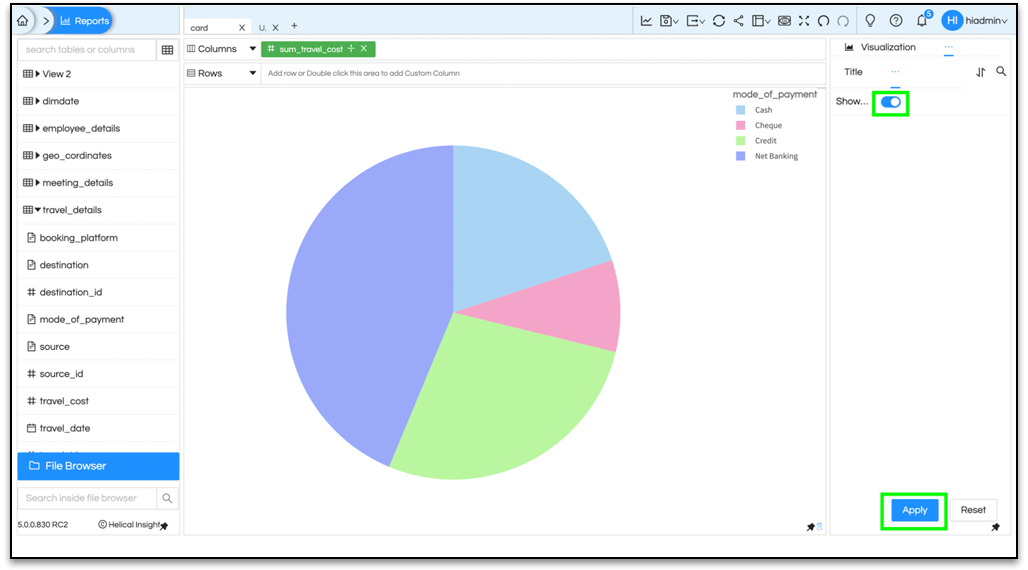
Step 4: Enable the Show button and select Apply.
Step 5 : Finally select the Generate icon and you will be able to see the percentage values on the pie chart.
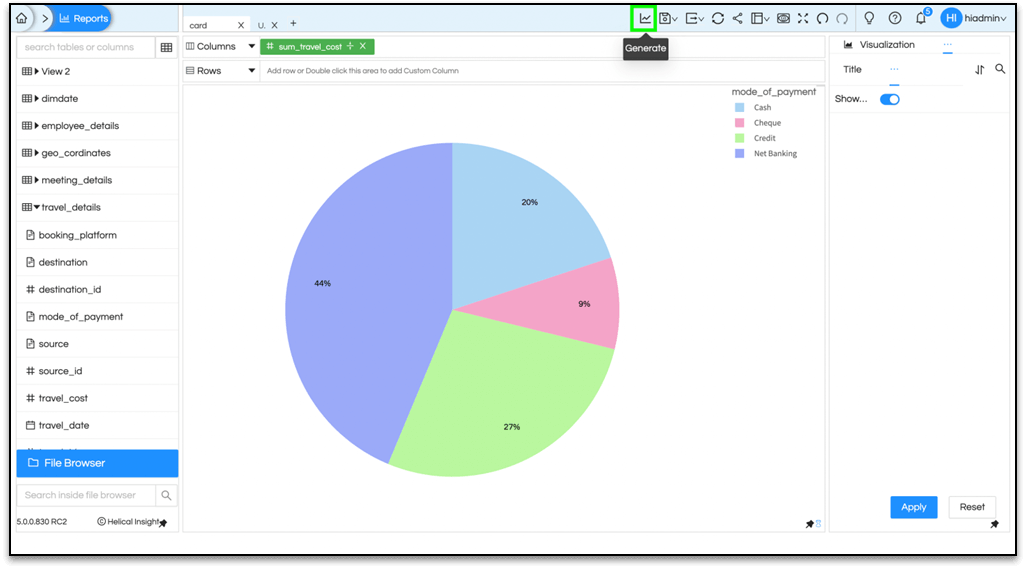
Now it is showing percentage and on hover it is showing actual values.
This feature is available from Helical 5.2.1 onwards and is only present for a single created donut charts created used Chart option, not for Grid Chart. Create a donut chart using “Chart”. In the properties of Radial, you will see one more called Show Title.
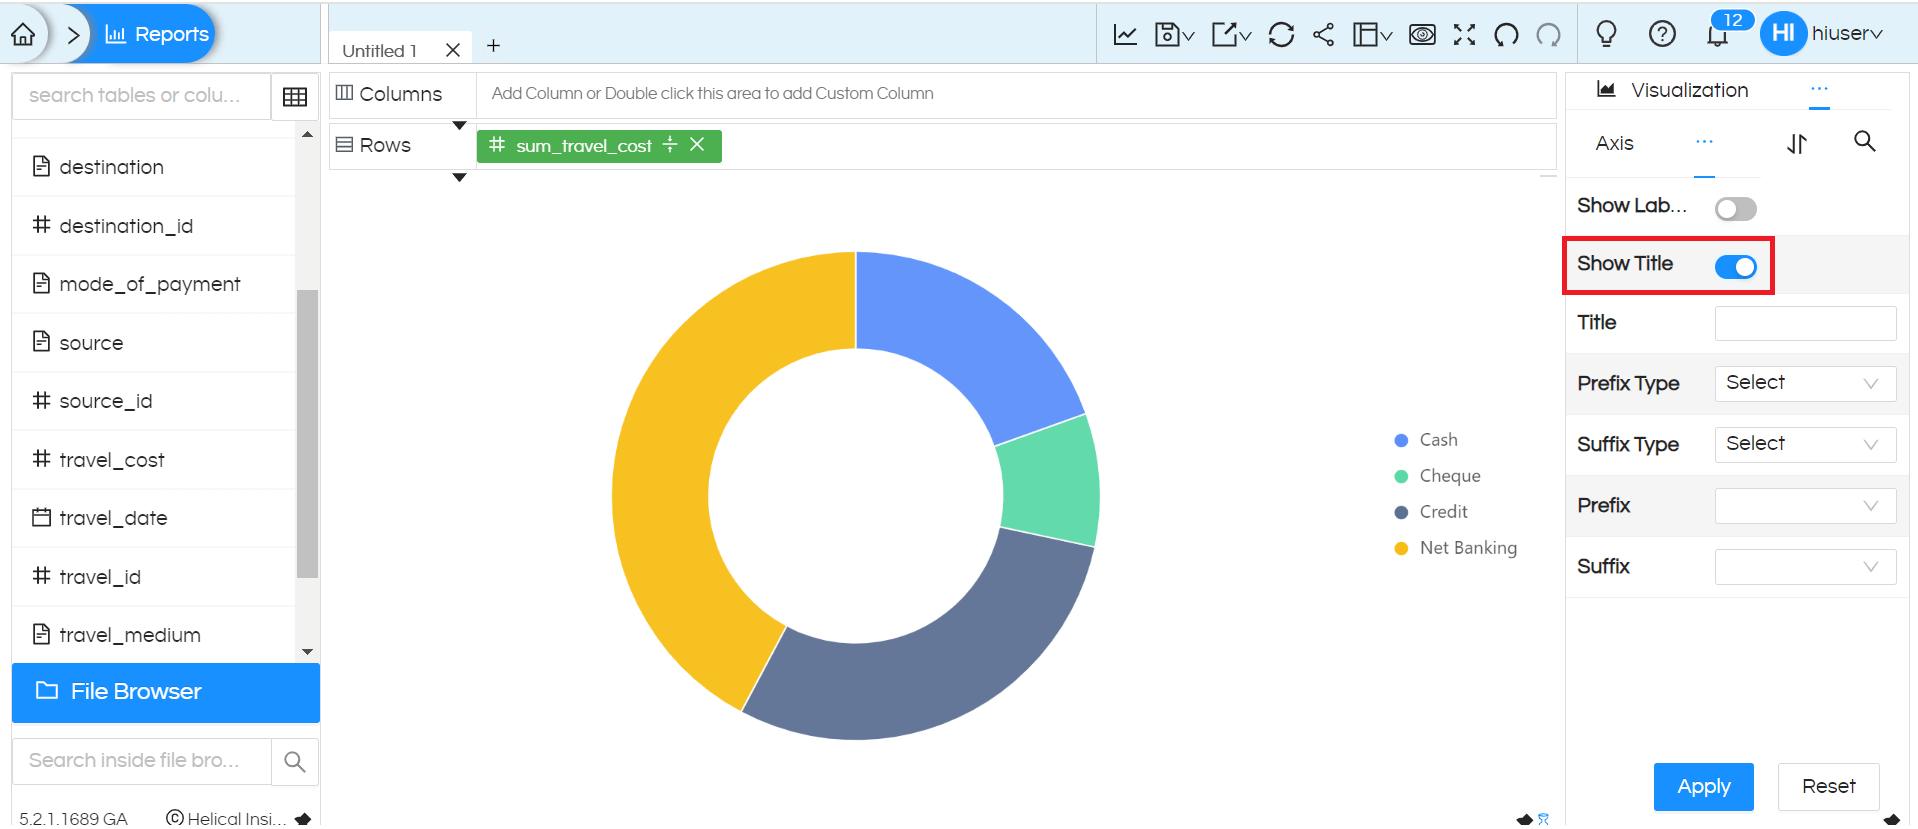
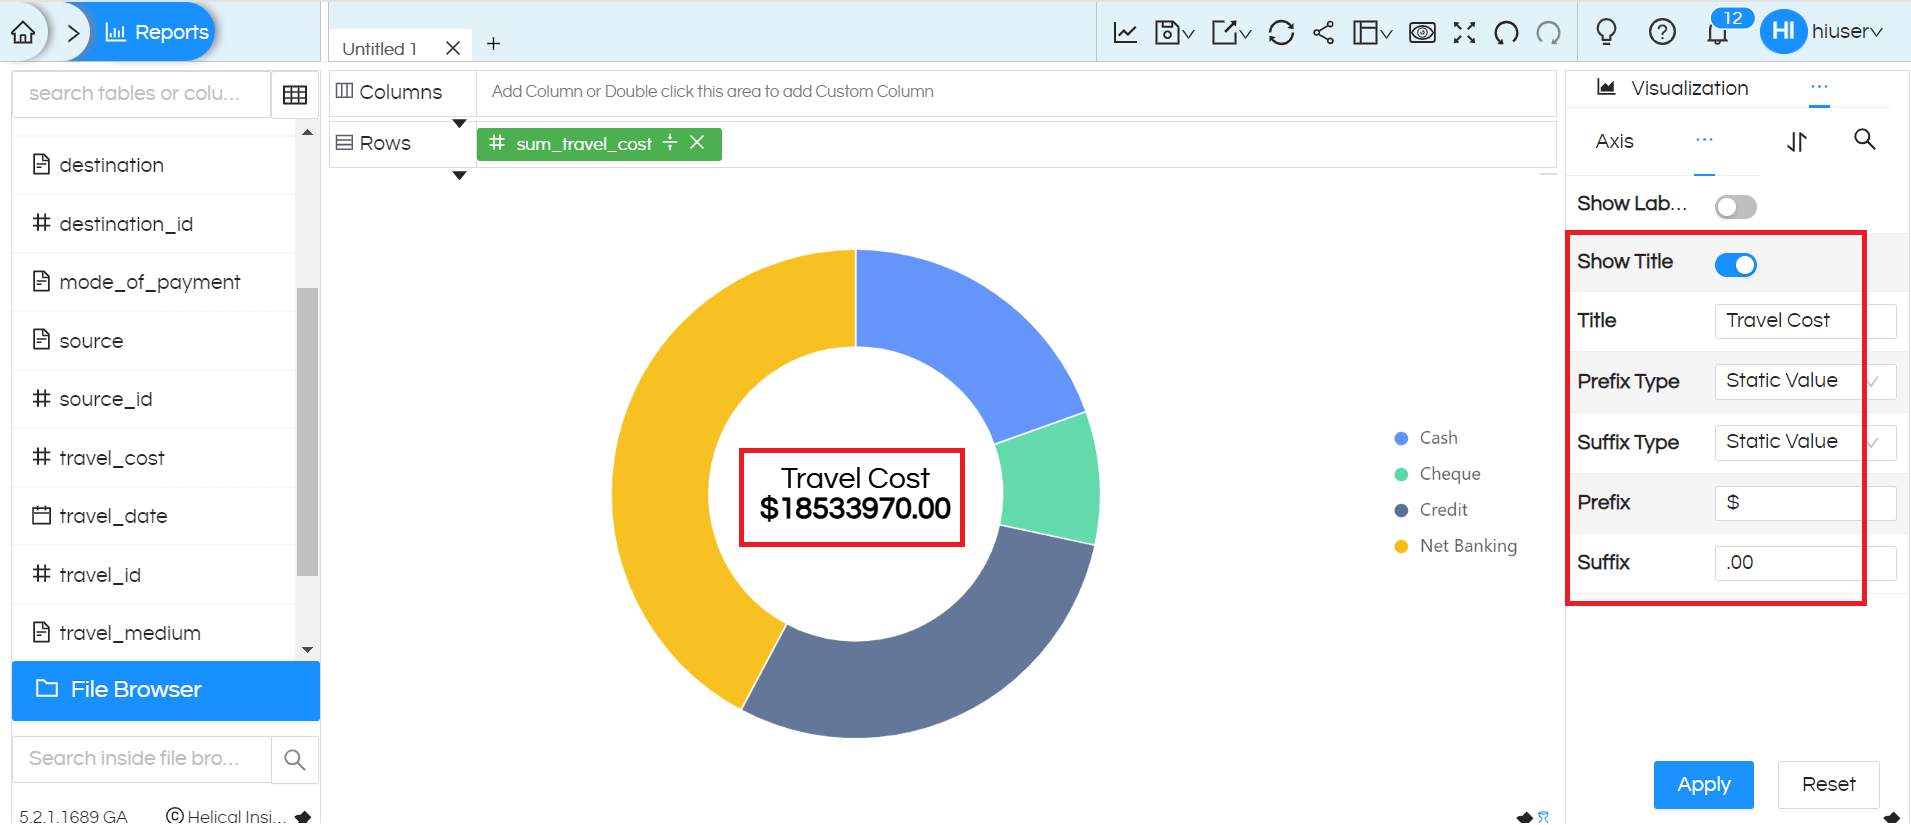
This customization will allow you to show the total value inside donut chart along with any text/tile of your choice. You can provide text for the Title to be shown at the centre, select Prefix and Suffix for the total value, and enter the respective values. Then click on ‘Apply‘
Starting from Helical Insight version 5.2.2, two more customization have been added to the Radial property: Show Label, Show Percentage and Show Value.
These customizations allow you to display multiple things like label, values, percentage in the labels in case of pie/donut charts.
Show Percentage: Using this property will show the percentage value also in labels
Show Label: Using this property will show the field values basis which the colors are split up.
Show Value: Using this property will show the values also in labels.
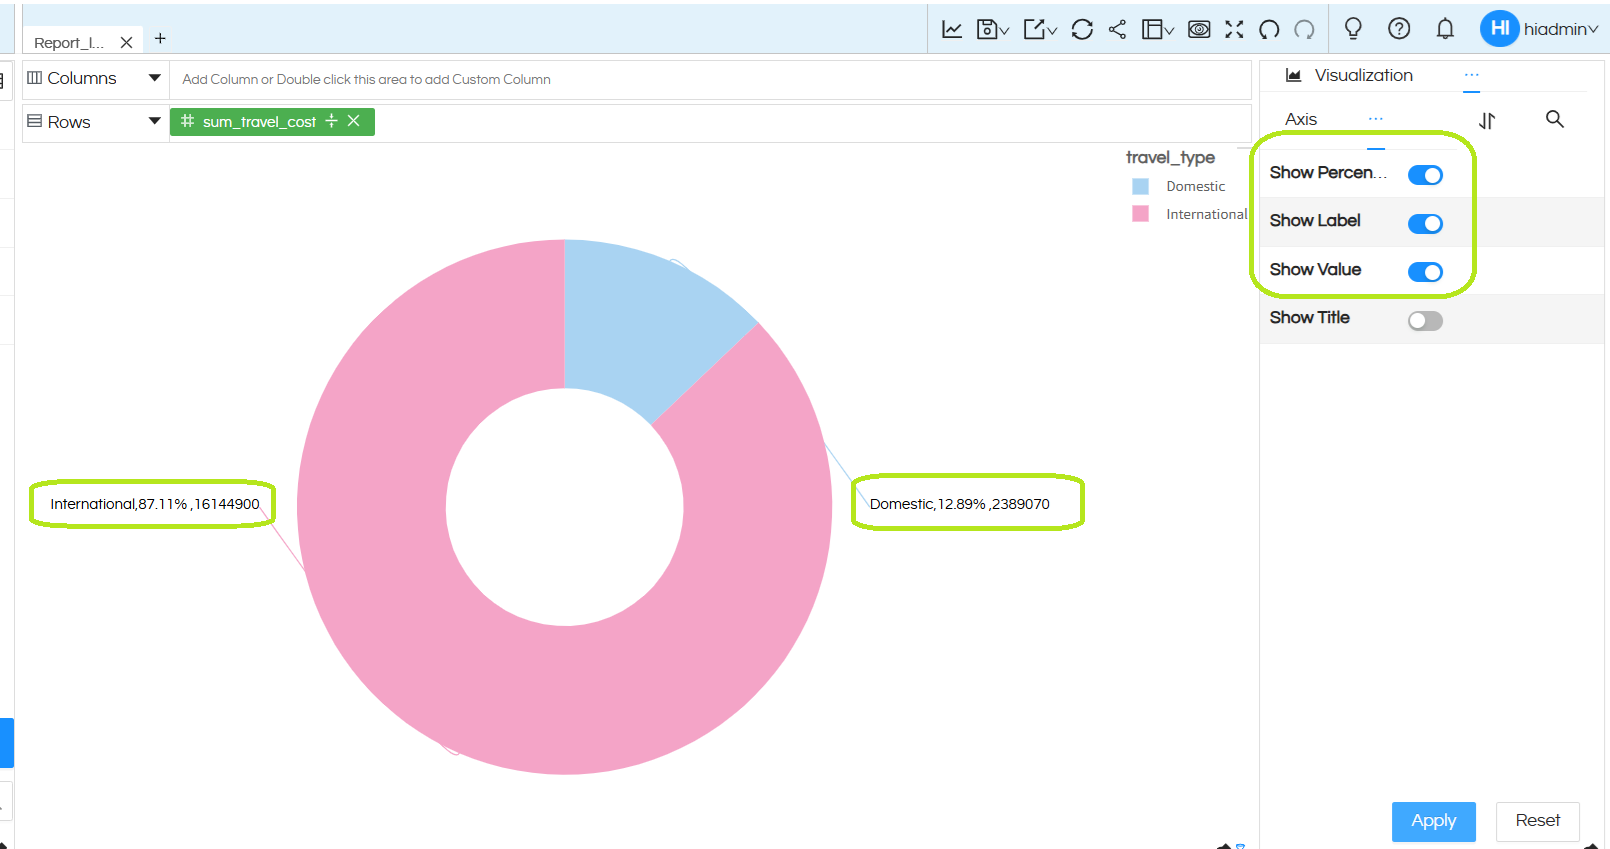
You can click on ‘Apply’ to see the results

