In this article you will learn about how to rotate the axis.
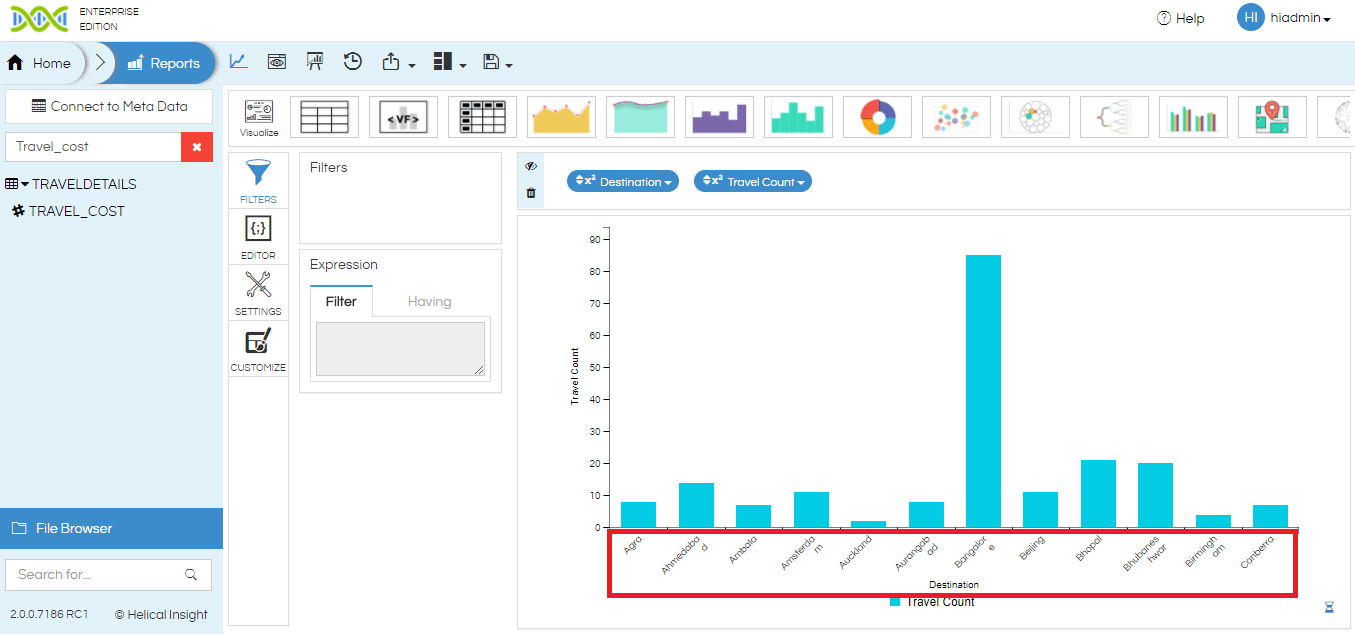
Initially, create or open existing report consist of chart wherein you want to do the same. Also, chart should be axis based. Here, we have used Bar Chart and highlighted region is a axis tick.

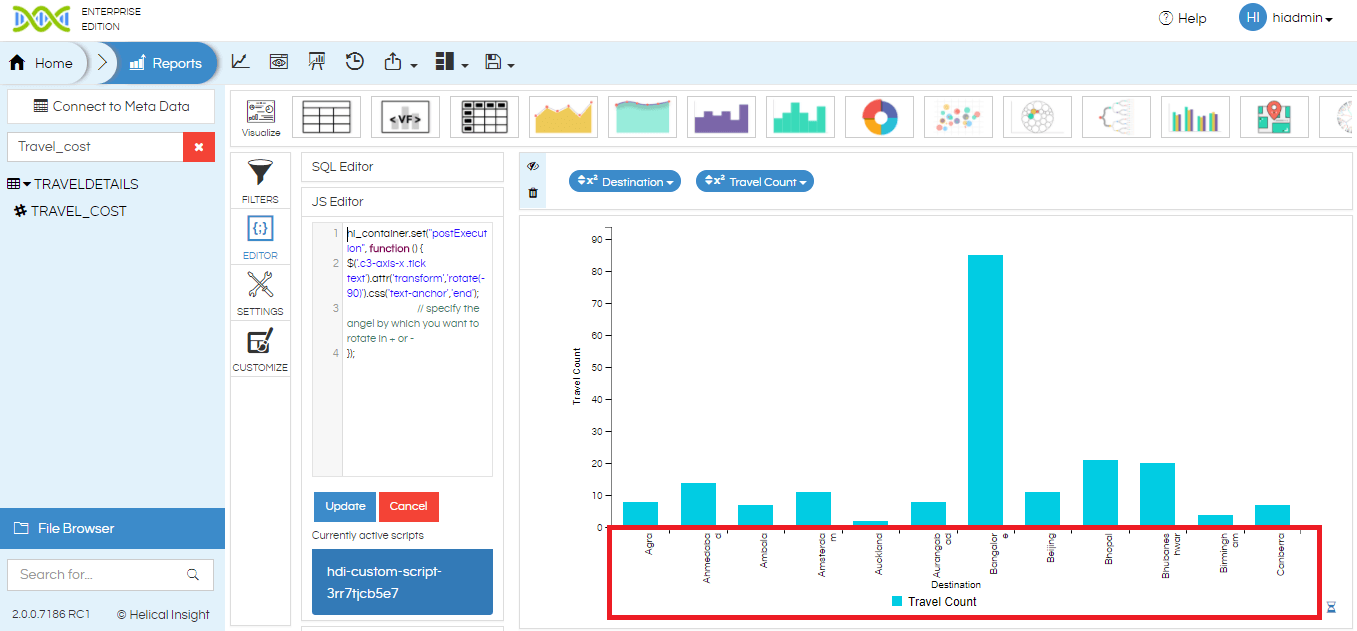
To rotate the axis tick will require a Javascript code. To apply the Javascript Code, go to Editor tab click on JS Editor, then enter the code and click on Inject to execute the entered code.
Javascript Code
hi_container.set("postExecution", function () {
$('.c3-axis-x .tick text').attr('transform','rotate(-90)').css('text-anchor','end');
                              // specify the angel by which you want to rotate in + or -
});
Output

Output shows that axis tick rotated by -90 degree. Similarly, you can set more value say +/- 180 degree or +/-270 degree and so on. Also, you can perform other chart customization using CSS and Javascript Code. Please refer to our chart customization article.
For more info, contact us at demo@helicalinsight.com

