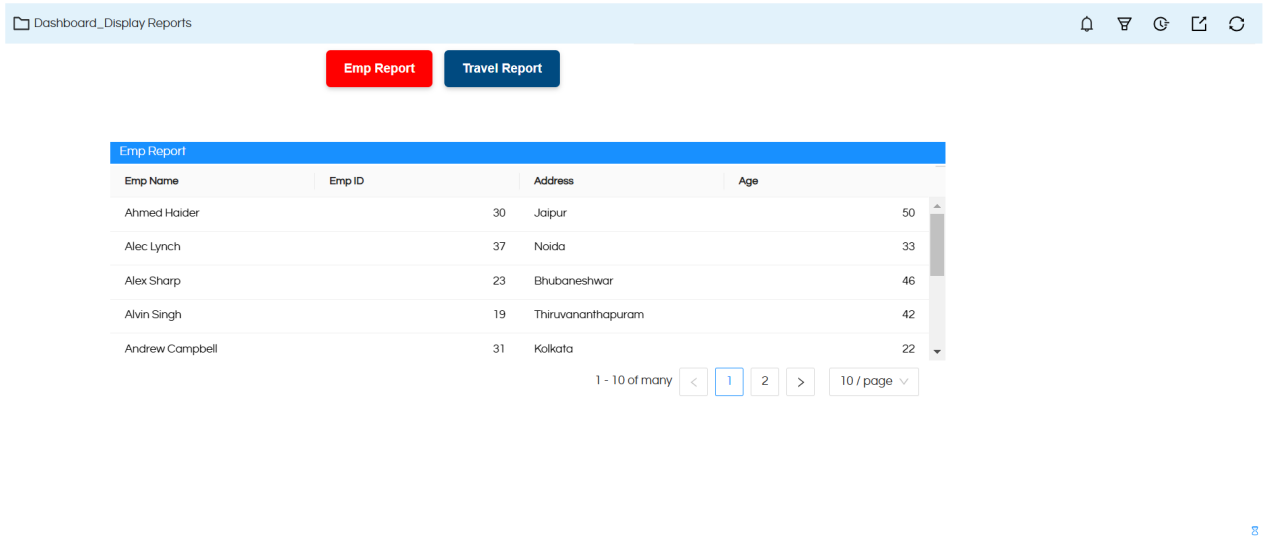
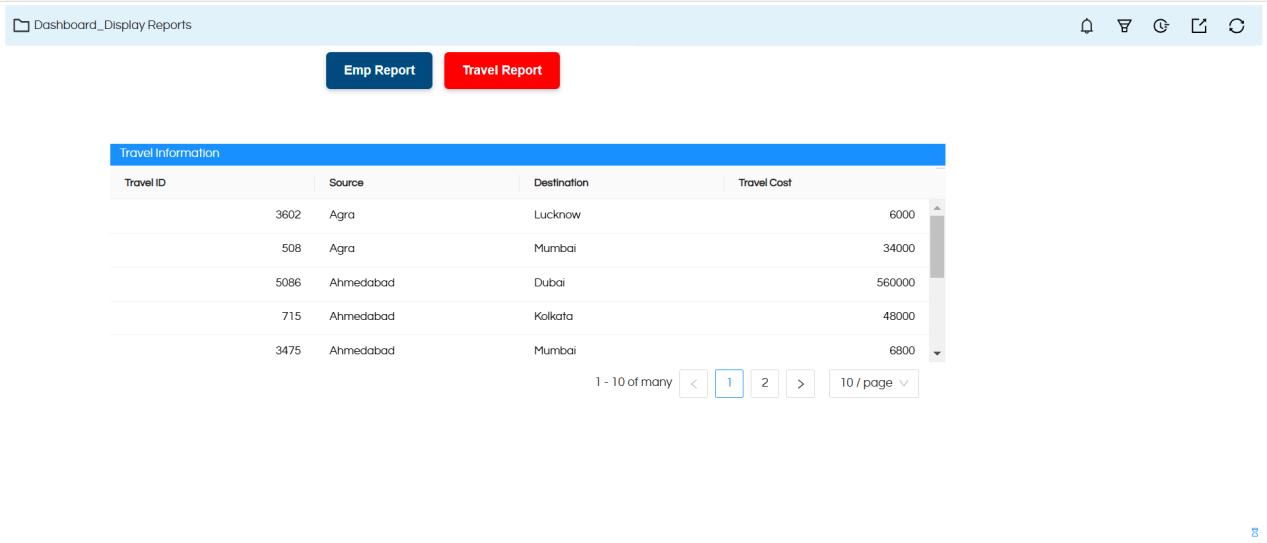
In this document, we will provide a sample of creating a button and displaying a report based on that button’s click.
Example: We will create two buttons: when we click on ‘Emp Report‘ it shows the Emp Report.
When we click on ‘Travel Report‘ button it shows the Travel Report.
Steps to be followed :
1. Created two reports: User Info Report and Travel Info Report
2. Added those reports to the Dashboard Designer.
3. Enable the overlay property and the keep the reports on top of each other. Read the blog below to understand and use overlays:
https://www.helicalinsight.com/overlay-functionality-dashboard-designer/
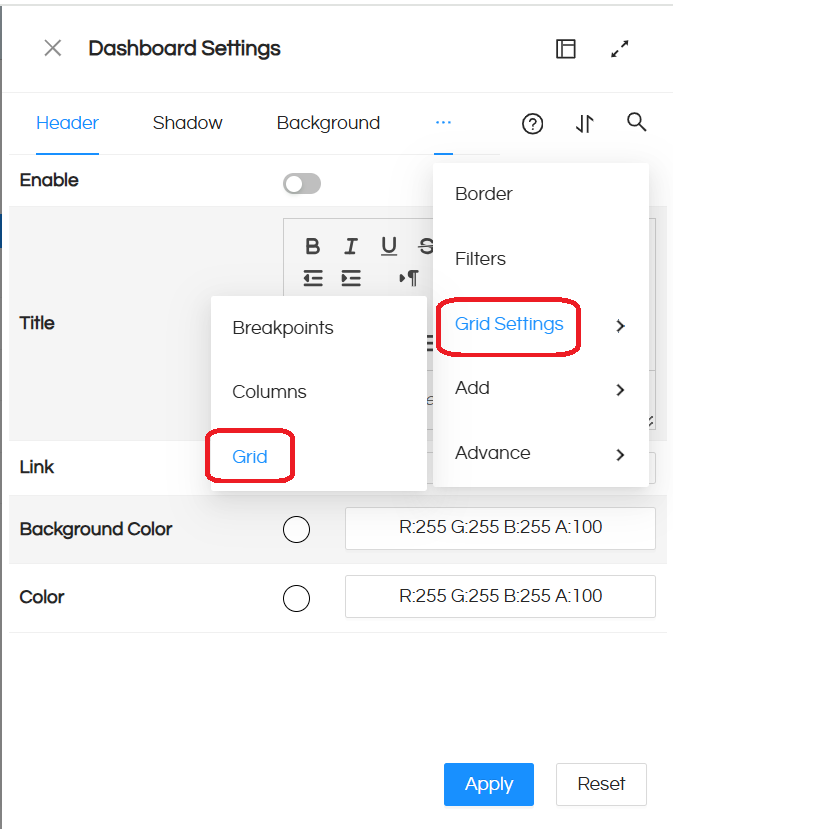
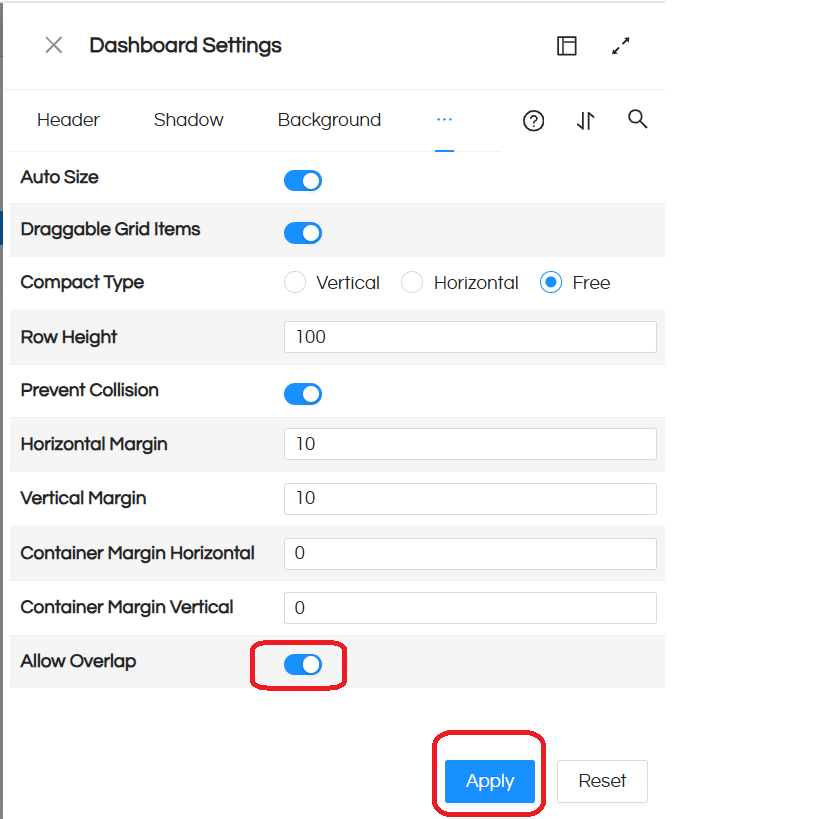
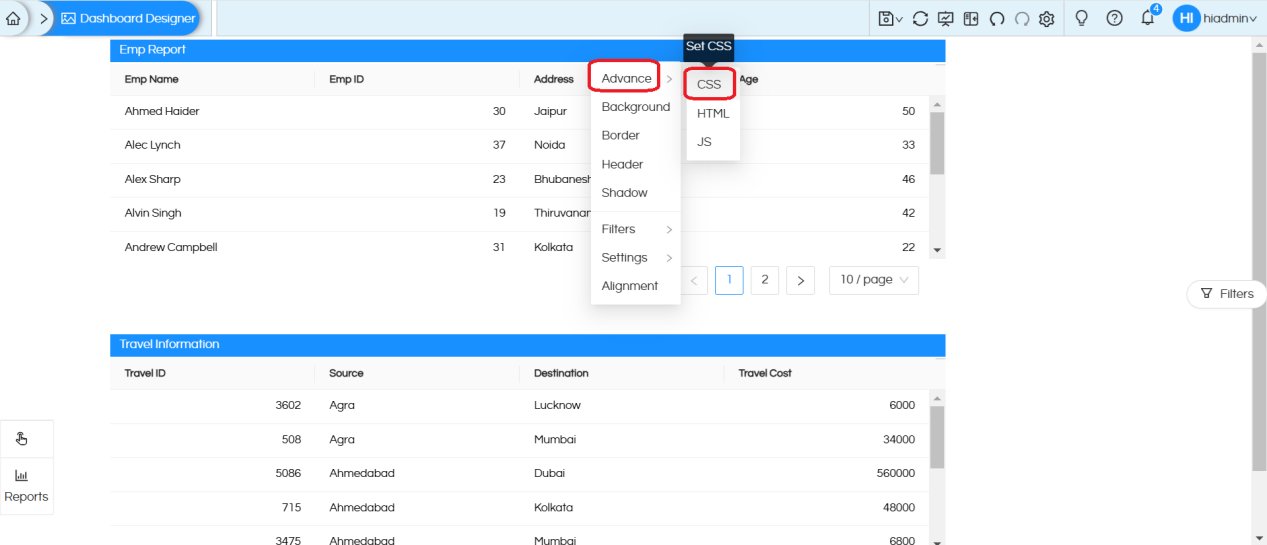
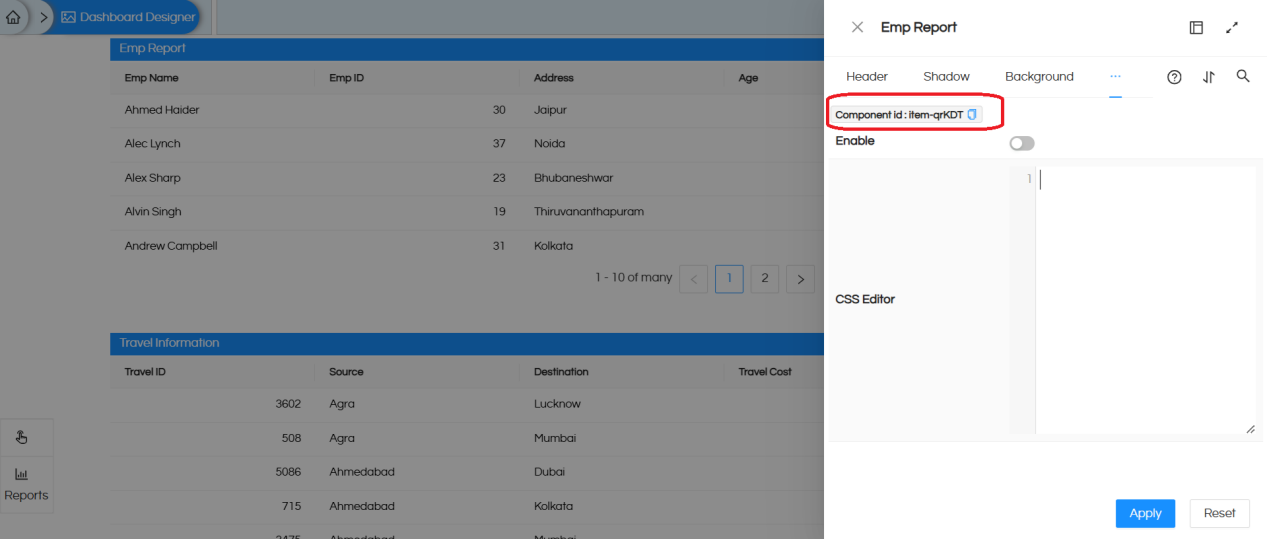
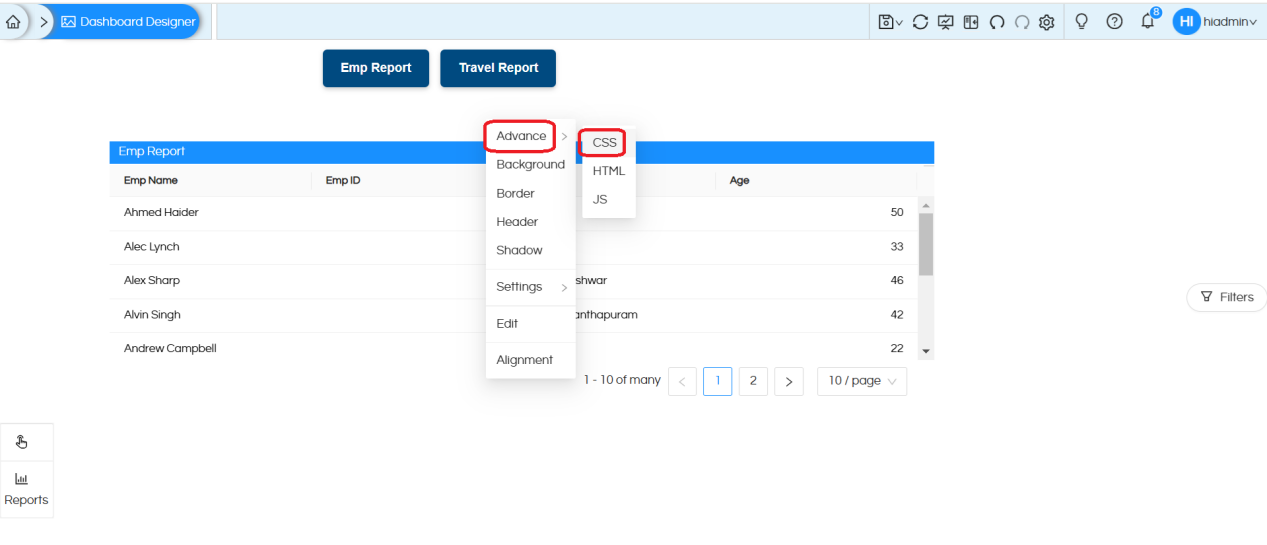
4. We need to note each report ID for writing the JavaScript logic to hide/show. To do this, right-click on the report, then select ‘Advanced’ > ‘CSS’. Once it is opened, take the component-id
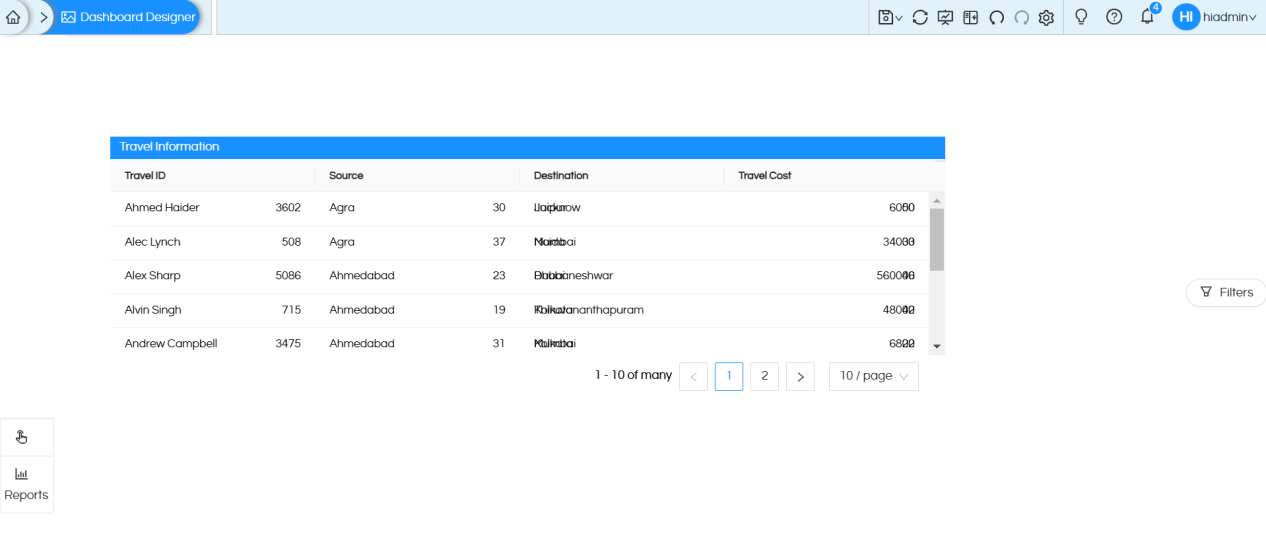
5. Align the reports on top of each other by maintaining the same width and height.
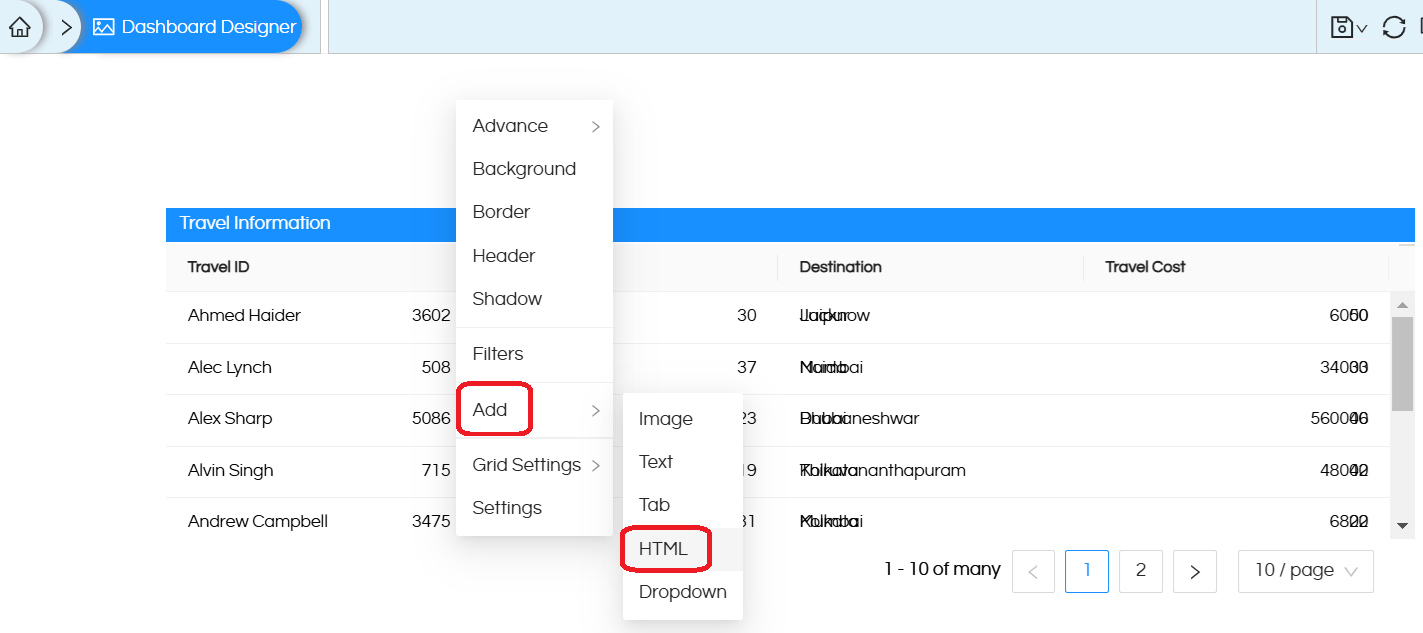
6. Add an HTML component by right-clicking on the empty space, then selecting ‘Add’ > ‘HTML’. Inject the following HTML code to create 2 buttons for 2 reports
<button id="report1" class="process-button">Emp Report</button>
<button id="report2" class="process-button">Travel Report</button>
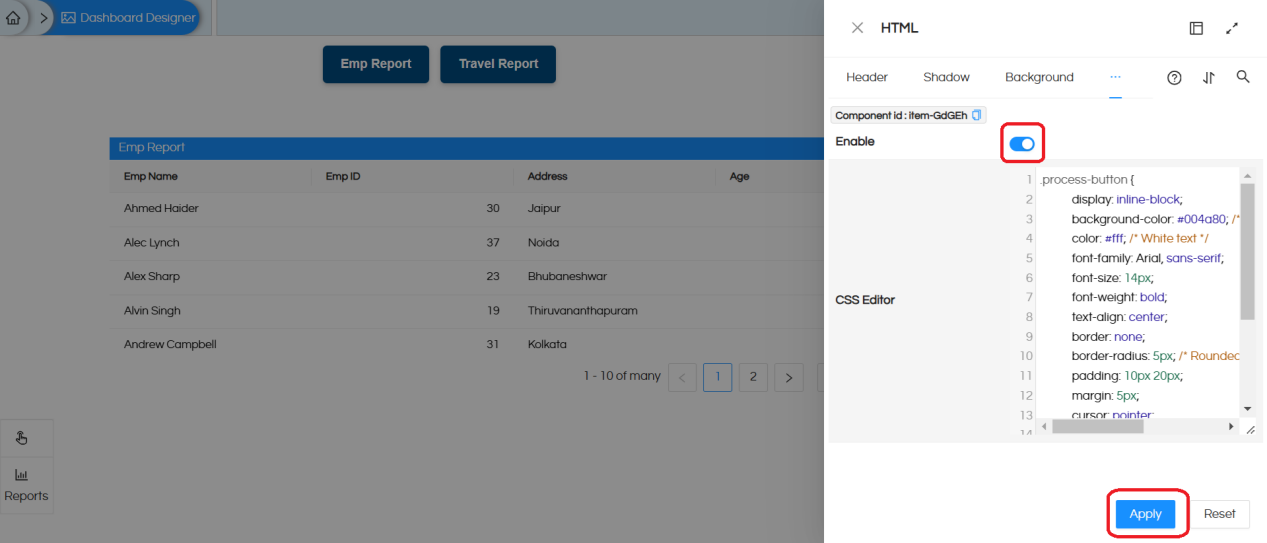
7.Inject the following CSS to change the look and feel of the button, if requird. Right-click on the HTML component, then select ‘Advanced’ > ‘CSS’
    .process-button {
        display: inline-block;
        background-color: #004a80; /* Dark blue background */
        color: #fff; /* White text */
        font-family: Arial, sans-serif;
        font-size: 14px;
        font-weight: bold;
        text-align: center;
        border: none;
        border-radius: 5px; /* Rounded corners */
        padding: 10px 20px;
        margin: 5px;
        cursor: pointer;
        box-shadow: 0px 2px 5px rgba(0, 0, 0, 0.2); /* Subtle shadow */
        transition: background-color 0.3s;
    }

    .process-button:hover {
        background-color: #0066cc; /* Lighter blue on hover */
    }

.process-button:active {
    background-color: #FF6347; /* Color when clicked (Tomato color) */
}
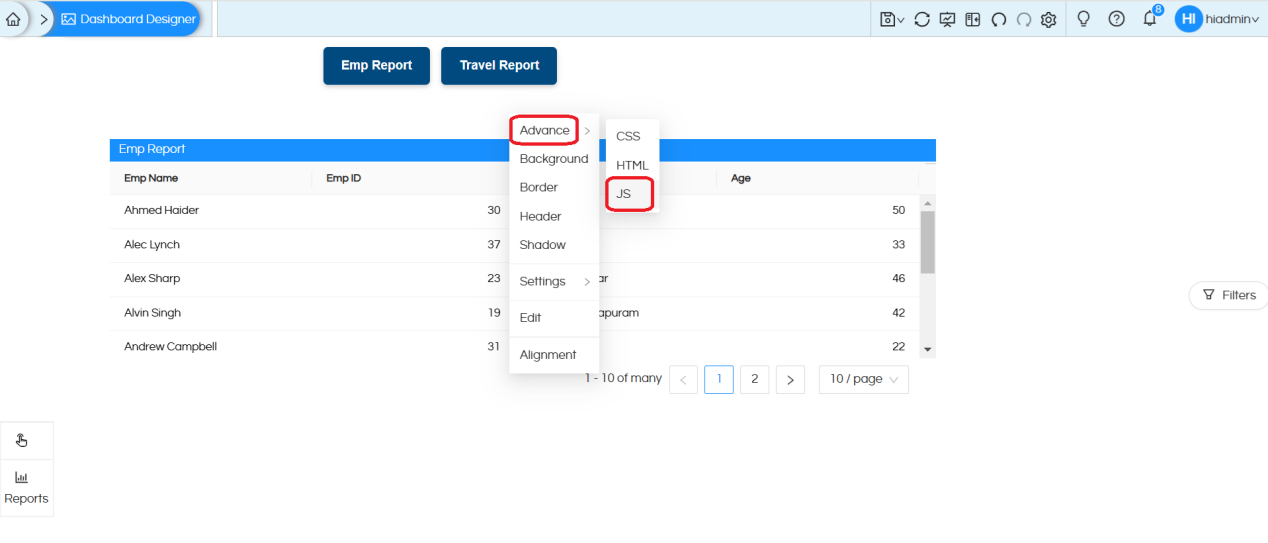
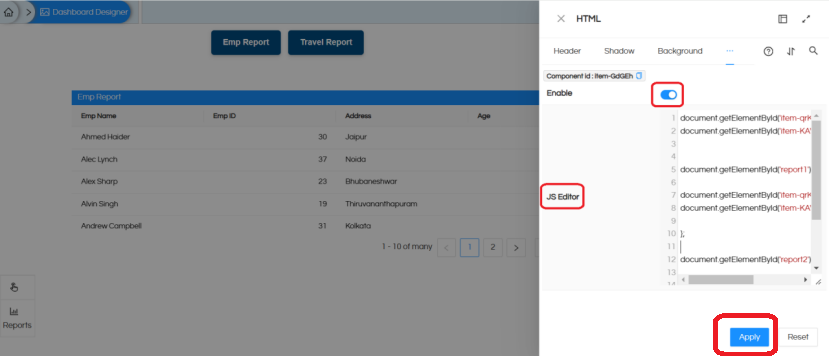
8. Inject the following JS to display the report based on the button click and change the button color
document.getElementById('item-qrKDT').style.display = 'block';
document.getElementById('item-KAWMZ').style.display = 'none';


document.getElementById('report1').onclick = function() {
resetButtonColors();
this.style.backgroundColor = 'red';

document.getElementById('item-qrKDT').style.display = 'block';
document.getElementById('item-KAWMZ').style.display = 'none';

};

document.getElementById('report2').onclick = function() {
  resetButtonColors();
this.style.backgroundColor = 'red';
document.getElementById('item-KAWMZ').style.display = 'block';
document.getElementById('item-qrKDT').style.display = 'none';

};

function resetButtonColors() {
        // Reset all buttons to their default color
        const buttons = document.querySelectorAll('.process-button');
        buttons.forEach(button => {
            button.style.backgroundColor = '#004a80'; // Original color (dark blue)
        });
}
9. Save the dashboard and open it in a new window
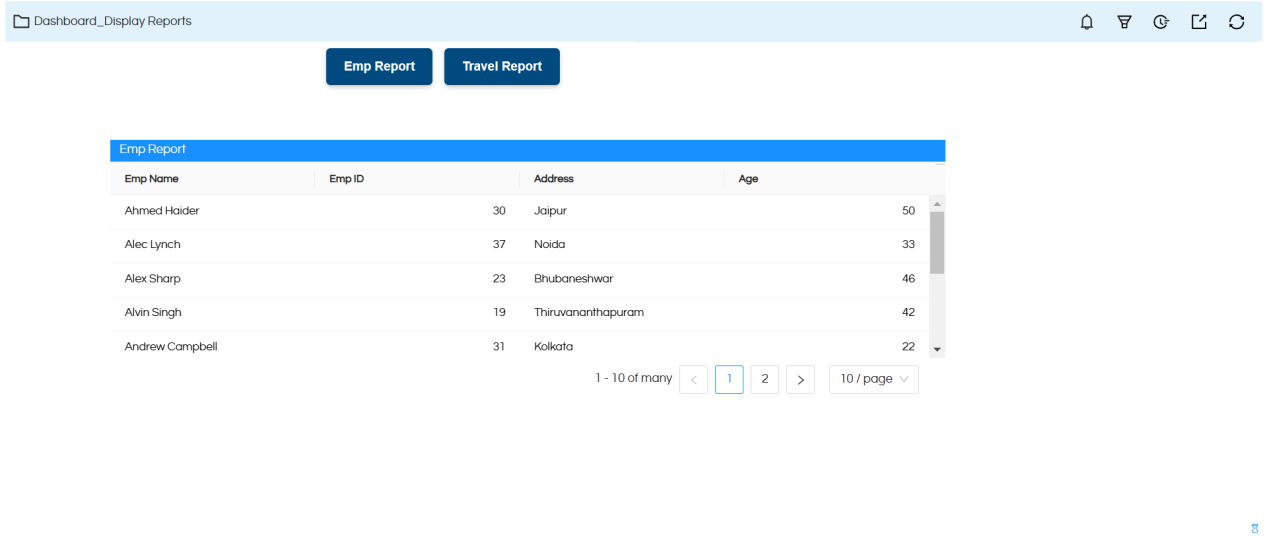
10. Based on the button click, the respective report will be displayed
