Introduction : In this blog we are going to explain the Community Edition reporting method. We will provide an overview of the various components present here.
In the Helical Insight we have two methods to create reports and dashboards
- Adhoc Reports : Adhoc reports is a UI driven drag drop method of reporting allowing to create reports. This is only part of the enterprise version. The created reports can then be used in the dashboard designer interface to create the dashboards.
- EFWCE Reports : EFWCE method can be used to create very complex reports (things which are not possible with Self service interface). Users who are using Community version of Helical Insight can also use EFWCE method to create reports and dashboards.
Basic overview of the Community method of reporting:
- Open the Helical Insight application in the browser
- Then click on Reports CE.

As soon as the page opens see an interface like below
In this page left corner you will see 4 report components ( rounded with red line)
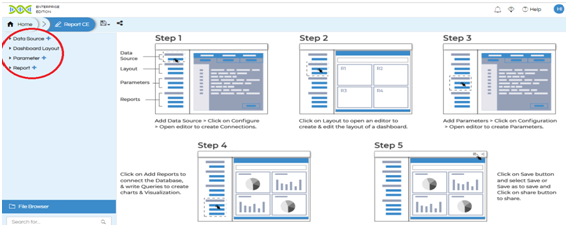
The main components are :
- Data Source
- Dashboard Layout
- Parameter
- Report
1. Data source :
This component is used to create data source connection. We can create multiple connections also.Click on plus symbol beside the Data source (see the below screenshot)

By default the connection is created with the name connection1, then connection2 so on and so forth. We can rename connection name using edit option (pencil icon).
We can delete the connection by clicking on delete icon.
There is an option of defining the type of DataSource. There are 4 kinds of DataSource types which are Managed, Plain JDBC, Adhoc and Groovy.
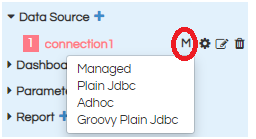
- Managed :
- Plain JDBC:
- Adhoc:
- Groovy Plain jdbc
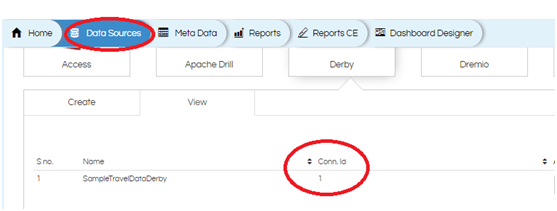
<globalId>1</globalId>
The global ID comes from the connection created in the data sources page. (see the below screenshot)

In this connection we provide driver name, db url, db username and password.
<driver>com.mysql.jdbc.Driver</driver>
<url>jdbc:mysql://localhost:3306/Travel_Data </url>
<user>hiuser</user>
<pass>hiuser</pass>
This ADhoc connection can only be used by the users using Helical Insight Enterprise Edition. We can give meta data file path and file name from hi_repository. The meta data file contains connection details . Those connection details are used to establish data source connection.
<location>1561019713637/1561065479314</location>
<metadataFileName>8176311d-3053-4975-bba7-5890863abcf6.metadata</metadataFileName>
Note: In order to find out the location and metadata file name you can click on “Home”, open file browser, navigate to the required metadata file and right click on it. There in the “Properties” we can get the path and file name which is used here.
Groovy Plain JDBC data source can be used wherein we can define the data connection in the Groovy script. This is more specifically used when people are using things like DBSwitching (Dynamic database switching), data security (hiding or showing data to a certain set of people roles users organizations) etc.
Please note that people who are using Helical Insight Enterprise Edition they implement data security directly at the metadata level via UI driven option. Whereas people who are using Community Edition and want to implement data security they will have to use Groovy plain JDBC option. The same is covered in details in our other blogs.
<Driver>org.postgresql.Driver</Driver>
<Url>jdbc:postgresql://localhost:5432/Travel_Data </Url>
<User>postgres</User>
<Pass>postgres</Pass>
			<Condition>
				import net.sf.json.JSONObject;
				public JSONObject evalCondition() {
					JSONObject responseJson = new JSONObject();
					 responseJson.put("driver","org.postgresql.Driver");
					 responseJson.put("url","jdbc:postgresql://localhost:5432/Travel_Data");
					 responseJson.put("user","postgres");
					 responseJson.put("password","postgres");
					return responseJson;
				}

			</Condition>
Create the data source connection / connections based on the requirement.
Note: In a similar way you can create multiple DB connections over here. These multiple connections can be used for various panels in the dashboard, input parameters etc.
Sample Report-Data Source
In the sample report we are creating the database connection type as “Plain Jdbc”. By default the connection is created with the name “connection1”, we can rename with help of “pencil” icon. If we click on configure, the configuration place holder will be shown.

Place the data source configuration code, then click on “apply” to save the configuration.
2. Dashboard Layout :
After making the datasources next step is the dashboard layout. In the dashboard layout we can basically specify the layout of the report, dashboards, input parameters which we are creating. All the divs are specified here within which those individual components gets rendered.
When you click on dashboard layout a layout similar to below will appear:

In the above screen shot we find two options (left side)
HTML and CSS .
If you click on HTML/CSS the place holder for respective component will be displayed and highlighted in the Dashboard layout panel.
We can place the code related to the layout in HTML and CSS will have the styling.
Sample Report HTML & CSS:
HTML :
<div id= “pie_chart”></div>
<div id= “chartHeading”></div>
CSS:
#chartHeading{
Width: 100%;
Height: 20%;
Border : 10px;
Background-color : Blue;
Font-family: TimesNewRoman
}

#pie_chart{
Width: 100%;
Height: 80%;
Border : 10px;
Background-color : Blue;
Font-family: TimesNewRoman
}
3. Parameters :
Parameters are used to filter the report data. These parameters can be single select, multiple select, date range, slider, date picker etc. We can create multiple parameters for the single report/dashboard.
When you click on add button, the parameter is created with default name parameter1, parameter2, parameter3 so on and so forth.

We need to configure the parameter in the configuration place holder which includes things like parameter name, type of parameter, display name, single or multiple select, default value, on which div id it should get added etc. The “Configuration” screen is already having the text written whose place holders content needs to be changes as per your requirement.
In the SQL place holder we should place SQLquery for populating the data for that specific input parameters.
After making the configuration and SQL changes make sure to click on “Apply”
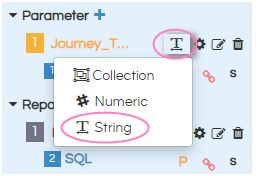
Input parameter Type: You can configure the input parameter type. See the below screenshot how to do the same.
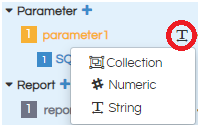
If you click on the rounded symbol, it will prompt three options to select from
- Collection:Used for multi select parameters of any data types.
- Numeric: Used for single select for numeric, float, Lat long, Binary etc)
- String: Used for single select (for String data types only). Date, date time etc also goes in string (single select only).
Other functionalities are:
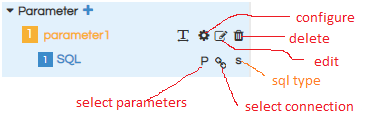
- Configure : By clicking on this we can have configuration screen and also SQL screen.
- Edit: We can edit name of the parameter
- Delete: We can delete the parameter
- Select Parameters : We can use this in order to specify that it should listen to some other input parameter and respond ( use case : cascading input parameters)
- Select Connection : We can choose which data connection we are using for the input parameter from the datasource connection we have created earlier.
- SQL type : there are 3 types of sql. (see the screenshot)
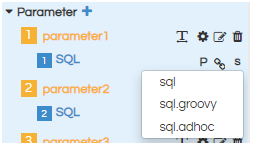
The type of sql are: Sql, sql.groovy and sql.adhoc.
We should select the type of sql based on the connection type we have chosen in the data source connection.
For managed, plain jdbc -> sql
Adhoc             -> sql.adhoc
Groovy plain jdbc    -> sql.groovy
See the below screenshot, you will find numbering for parameters and sql.
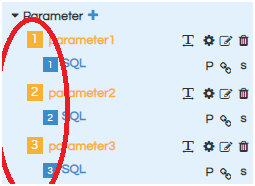
Those numbers represent the count of parameters and sql connections present.
Sample report – Parameters :
In this sample we are creating parameter as “single select”. By default the parameter is created as “parameter1”,we can rename the parameter with help of “pencil” icon.
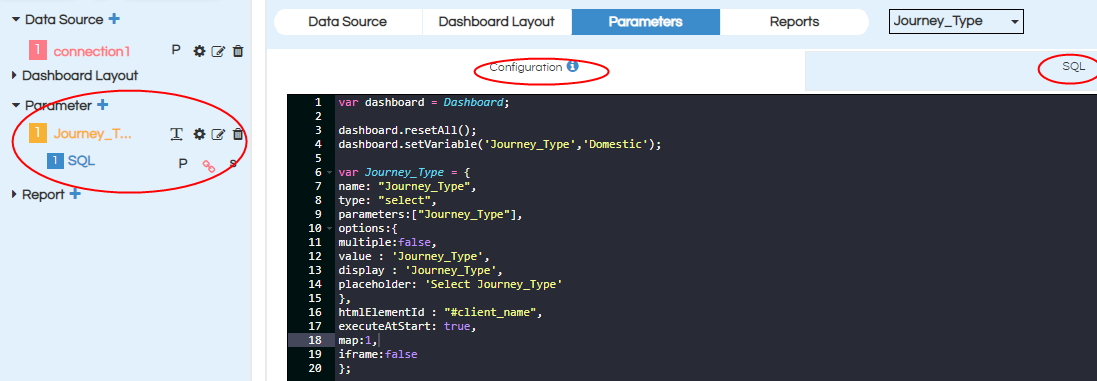
We should place the code for Parameter configuration, parameter query in their respective place holders. Click on apply button to save all the configurations.
1. Journey_Type: (Single Select)
Choose connection as “connection1”(previously created in data sources). Here “Journey_Type” is a Single-select input control, so we need to choose input type as “String” as shown in below image. By default it is always “String”.
Note: For all multi select parameters we should select “Collection” irrespective of parameter datatype. If it is single select parameter we choose the type based on datatype of parameters
Configuration :
var dashboard = Dashboard; //creating dashboard variable
dashboard.resetAll()

dashboard.setVariable('Journey_Type','Domestic'); // setting default value for the parameter Journey_Type as Domestic. This is key value pair
dashboard.setVariable('Client','Envision'); // setting default value for the parameter Client as Envision. This is key value pair
var Journey_Type = { // create variable for created parameter name
name: "Journey_Type",// provide created parameter name
type: "select", //provide input parameter type
parameters:["Journey_Type"], // provide list of all parameters which we want to set
options:{

multiple:false, // multi select parameter -true , single select parameter -false
value : 'Journey_Type', // SQL Column name which we want to pass internally to filter the data
display : 'Journey_Type',// provide column name which should display on the report at frontend. Can be same as value or different
placeholder: 'Select Journey_Type' //If nothing is selected this message will be shown
},
htmlElementId : "#client_name",// provide html div id on which the parameter should be renderd
executeAtStart: true, // Boolean value to decide if the component will execute at start or will be triggered on some event.
map:2// provide parameter sql_id (sequence number)
};
SQL :
select distinct Journey_Type from `Travel_Data`.`Traval`
4. Report :
We can configure different visualizations to render in different divs specified in the dashboard layout.
When clicked on add report (+) button something like below will appear (see the screenshot). Reports are created by default with the name Report1, Report2 etc. You can click on “Edit” icon to rename the report.

In the left panel we find report, SQL, Visualization related options.
Click on configure and then on the right side we can see the place holders for report configuration ,SQL, Visualization. Place the respected code and then click on Apply. The same is covered in details towards the latter part of the document.
See the below screenshot for various functionalities:
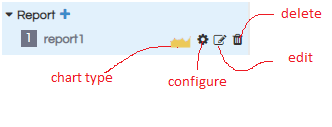
Chart type: we can choose the type of chart from the drop down.
The existing charts are :
Area , Area Spline , Area Step , Bar , Donut, Gauge , Line, Pie, Scatter, Spline, Step, Cross Tab, Table, Custom
Custom visualization: In the chart options we have an option called “Custom”.
We use custom visualization when we want to use other visualizations chart other than existing charts/visualizations provided out of the box. Usage of this is covered in detail in other tutorials.
Configure: It provides place holders to configure report. In the configuration we can provide report name, chart type, listeners, parameters, vf id, vf file_name and the div id on which the report should be rendered.
Edit: We can edit the report name
Delete: We can delete the report
In SQL: select the parameters which are going to affect that specific report, select the connection created earlier and sql type (based on the datasource type created).
In the SQL place holder we will write the report query.
In the Visualization place holder we generally provide measures and dimensions. When we are using “Custom Visualization” we will also have to write code responsible for rendering that specific visualization.
Sample Report pie chart:
when we create report , the report is created with the default name “report1”, we can rename with help of “pencil” icon, renamed as “Pie”.

Place the code for report configuration ,SQL, Visualization in the respective code and then click on Apply.
Configuration :
var pie= { //
name: "pie", //created report name
type:"chart", // no need to change
listeners:["Journey_Type","Client"], // provide list of parameters which should effect the report/dashboard
requestParameters :{
Journey_Type : "Journey_Type",
Client : "Client"
},
vf : {
id: "1", //visualization sequence_id
file: "__efwvf_name__" // no need to change
},
htmlElementId : "#pie_chart",// provide the div id on which chart should render
executeAtStart: true //Boolean value to decide if the component will execute at start or will be triggered on some event.
};
SQL :
select `Travel_Data`.`Traval`.`Client` as `Traval_Client`,
sum(cost) as cost from `Travel_Data`.`Traval`
where Journey_Type = ${Journey_Type} and (client in (${Client}) or '---All---' in (${Client})) -- In $ we are passing the values of input parameters defined in Parameters section.
group by `Traval_Client`
Visualization :
<Dimensions>traval_Client</Dimensions>
<Measures>cost</Measures>
To be Noted: In case if your report/dashboard is having multiple measures or dimensions the same we need to provide in the respective tags with comma(,) separated.
(Ex :source, destination, Travel_Type, Journey_Type ,cost, value )
After completing all the steps save the CE report :
We can see the the options like save, save as and share the report.
In the back end server location the following files gets created:
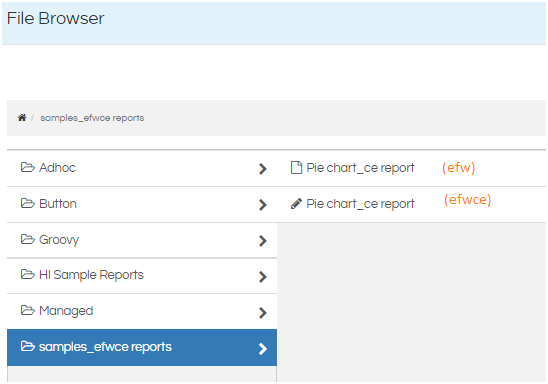
- Efw (Report View file which can also be accessed from the file browser from the frotnend)
- Efwce (Report edit file which can also be accessed from the file browser from the frontend, this file can be used to edit the EFW CE report being created)
- Efwvf :: This file contains the information about the visualization being used.
- Html :: This file contains HTML layout, CSS, parameters divs etc.
- Efwd :: This file has got all the datasource related details
On the front end file browser we can see the below kind of files:
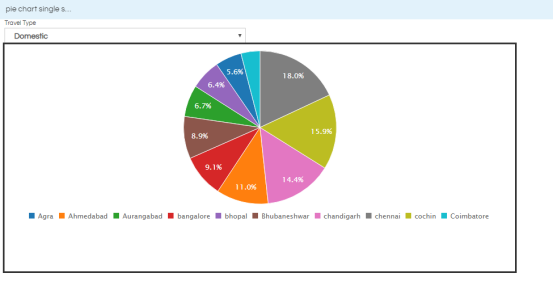
Sample Report view with single select parameter :
For further assistance, kindly contact us on support@helicalinsight.com or post your queries at Helical Insight Forum
