In today’s dynamic business world, making data-driven decisions is essential for staying competitive. Reporting tools are crucial in converting raw data into actionable insights that drive informed strategies and outcomes. These tools enable businesses to track key metrics, identify trends, and generate reports that inform strategic planning and operational improvements.
What is a Reporting Tools?
A reporting tool is a software application that collects, processes, and presents data in a structured and meaningful format. It allows users to:
- Gather data from various sources: Databases, spreadsheets, cloud applications, and more.
- Transform data: Clean, filter, and aggregate data to prepare it for analysis.
- Create reports: Generate a variety of reports, including dashboards, charts, graphs, and tables.
- Share insights: Distribute reports to stakeholders across the organization.
- Analyse data: Perform basic analysis, such as trend analysis, variance analysis, and key performance indicator (KPI) tracking.
Transform your data with Helical Insight—your ultimate reporting tool! Start today with a free demo and 30-day trial!
Main Types of Reporting Tools
- Static Reporting Tools: Generate pre-defined reports on a regular schedule.
- Dynamic Reporting Tools: Allow users to create custom reports and explore data interactively.
- Dashboarding Tools: Provide a visual overview of key metrics and performance indicators.
- Self-Service Reporting Tools: Empower users to create their own reports without relying on IT support.
Top 10 Reporting Tools for 2025
1. Helical Insight

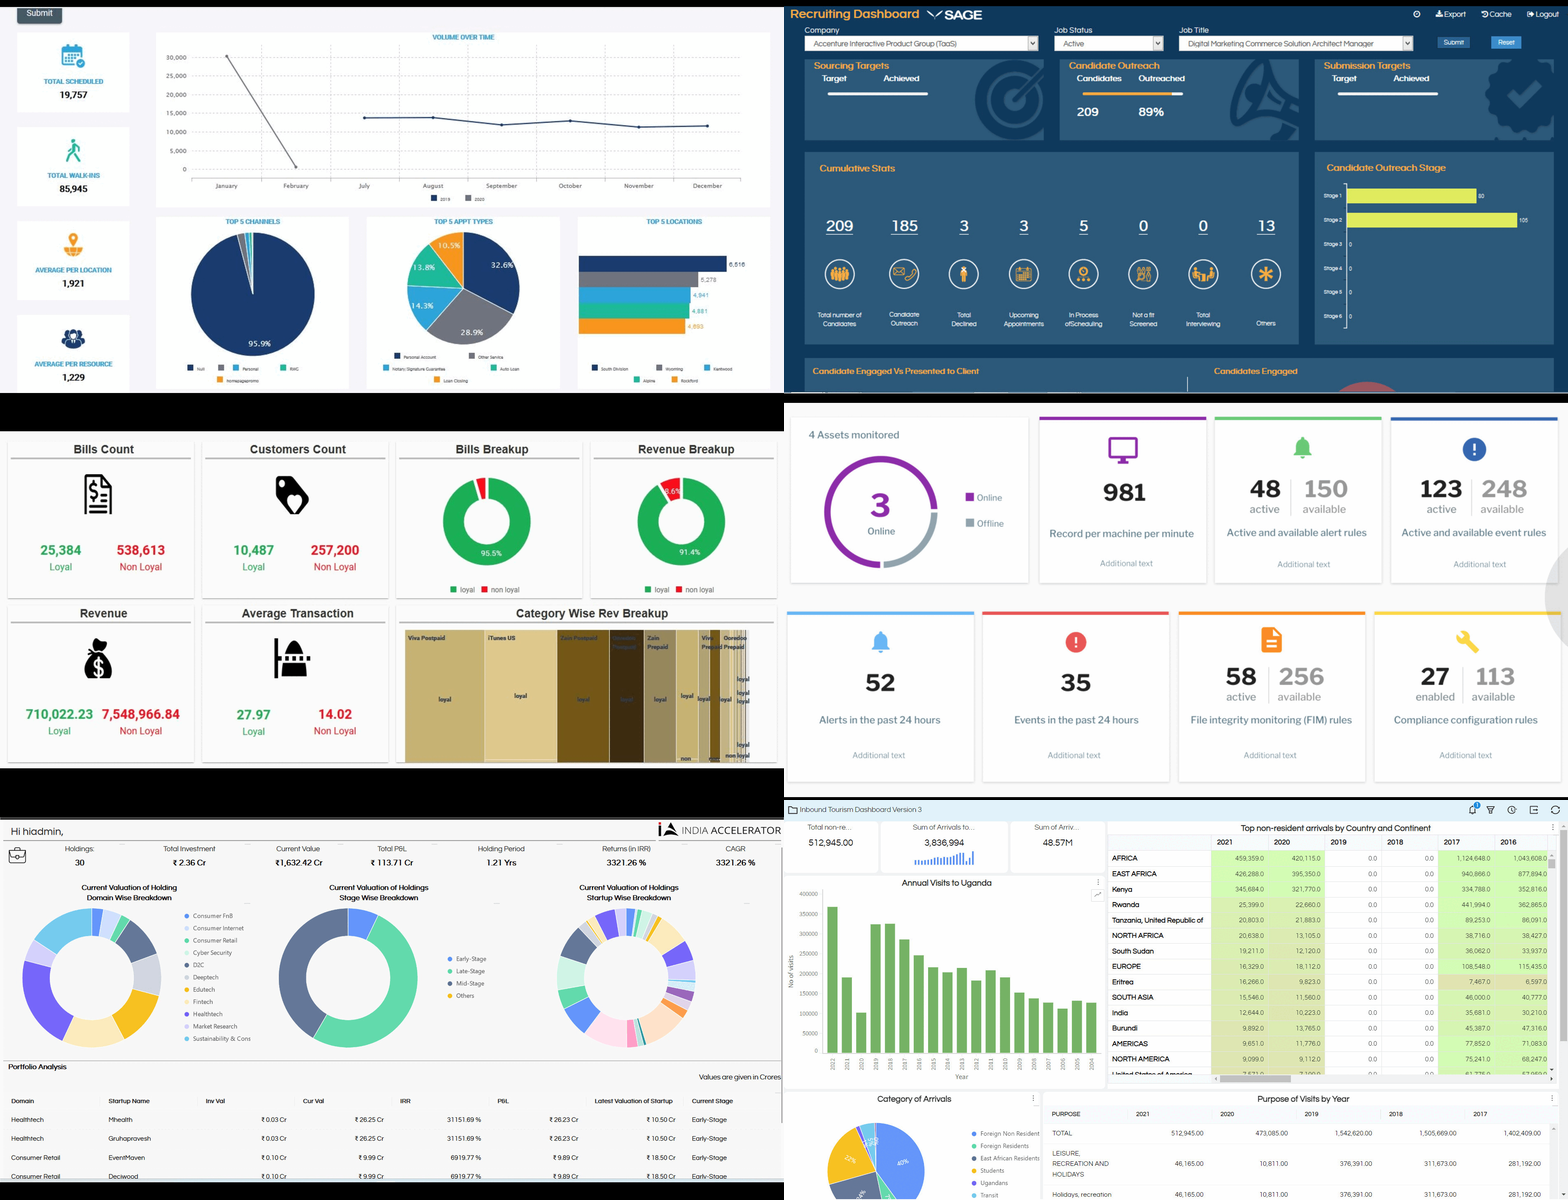
Helical Insight is an open-source BI and reporting tool that stands out for its flexibility and customization options.
Key Features:
- Open-source platform
- Flat pricing for enterprise version
- Embedding, white labeling and SOS support
- Real-time data processing and reporting
- Customizable dashboards and reports
- Features and UI UX similar to Tableau
- Data connectivity and transformation capabilities
- Reporting formats: Support for various report formats (PDF, Excel, etc.).
- User-friendliness: Intuitive interface and easy-to-use features.
- Security and compliance: Robust security measures and data privacy features.
- Scalability and performance: Ability to handle large volumes of data and perform analysis quickly.
- Integration capabilities: Integration with other business applications.
- Customer support: Excellent customer support and resources.
Helical Insight is an ideal reporting tool due to its open-source flexibility, customizable dashboards, and real-time data processing. It offers seamless integrations, robust security features, and scalability, making it perfect for businesses seeking cost-effective, adaptable, and user-friendly reporting solutions that grow with their needs.
Register here to learn more.
2. Sisense

Sisense offers an end-to-end BI and reporting platform that simplifies complex data and transforms it into interactive dashboards.
Key Features:
- Cloud-based and on-premise options
- Powerful data integration capabilities
- AI-driven analytics
Transform your data with Helical Insight—your ultimate reporting tool! Start today with a free demo and 30-day trial!
3. Power BI

Power BI, developed by Microsoft, is one of the most popular reporting tools, known for its integration with Microsoft products and easy-to-use interface.
Key Features:
- Integration with Microsoft Office 365 and Azure
- Drag-and-drop interface for building reports
- Real-time dashboard updates
4. Domo

Domo is a cloud-based business intelligence and reporting platform that helps businesses create visually stunning and interactive reports.
Key Features:
- Real-time data access and reporting
- Easy-to-use drag-and-drop interface
- Collaboration features for team-based reporting
5. Datapine
Datapine is a self-service BI tool that enables businesses to easily create dashboards and reports from their data.
Key Features:
- Intuitive data visualization and reporting
- Automated reporting
- Strong collaboration features
6. Tableau
Tableau is one of the most well-known data visualizations and reporting tools, offering powerful capabilities for creating interactive and shareable reports.
Key Features:
- Drag-and-drop interface
- Extensive visualization options
- Real-time data updates
Transform your data with Helical Insight—your ultimate reporting tool! Start today with a free demo and 30-day trial!
7. Klipfolio

Klipfolio is a cloud-based reporting and dashboard tool that provides real-time business metrics and visualizations.
Key Features:
- Real-time data tracking and reporting
- Customizable dashboards and KPIs
- Integrations with numerous data sources
8. Looker

Looker is a business intelligence platform that emphasizes data modelling, enabling organizations to create custom reports and dashboards.
Key Features:
- Cloud-based and scalable
- Real-time reporting
- Advanced data modelling capabilities
9. Qlik Sense

Qlik Sense is self-service data analytics and reporting platform with a focus on interactivity and ease of use.
Key Features:
- Associative data engine for dynamic reporting
- Advanced data visualizations
- Real-time data analytics
10. IBM Cognos

IBM Cognos is a comprehensive business intelligence suite designed to help organizations with data analysis, reporting, and dashboard creation.
Key Features:
- Advanced reporting and analytics
- Self-service dashboard creation
- AI-powered insights
Transform your data with Helical Insight—your ultimate reporting tool! Start today with a free demo and 30-day trial!
Conclusion
Selecting the right reporting tool is crucial for businesses to gain valuable insights from their data and make informed decisions. By carefully evaluating your business needs, considering your budget and technical resources, and exploring the features of the top 10 tools mentioned above, you can choose the best reporting solution to empower your organization with data-driven insights and drive success.
FAQs: Top 10 Reporting Tools
What are the top 10 reporting tools businesses use today?
The top 10 reporting tools include Helical Insight, Power BI, Tableau, Looker, Qlik Sense, Metabase, Redash, Superset, JasperReports, and Zoho Analytics. Among these, Helical Insight is a standout open-source option for startups and enterprises alike.
What is the best open source reporting tool?
Helical Insight is considered one of the best open source reporting tools. It offers a customizable architecture, canned reporting, and a workflow engine that outperforms many competitors in flexibility and pricing.
Why choose Helical Insight over other reporting tools?
Helical Insight offers features like cross-database joins, developer extensibility, a self-service interface, and flat pricing—making it ideal for organizations that need scalable, customizable, and cost-effective reporting.
Can Helical Insight be used by non-developers?
Yes, Helical Insight provides a user-friendly interface, drag-and-drop dashboard building, and natural language querying—enabling business users to create reports without writing code.
How does Helical Insight support enterprise reporting needs?
Helical Insight supports enterprise-grade features such as multi-tenant architecture, RBAC, embedding, and direct developer support, making it suitable for large-scale business intelligence deployments.
Are open source reporting tools secure and reliable?
Yes, open source tools like Helical Insight are secure, reliable, and actively maintained. They offer transparency, community support, and enterprise-level security configurations.
How easy is it to integrate Helical Insight with existing data sources?
Helical Insight supports integration with a wide range of data sources, including SQL databases, NoSQL, flat files, and cloud storage. It also allows cross-database joins, enhancing data analysis capabilities.
What is canned reporting, and does Helical Insight support it?
Canned reporting refers to pre-built, ready-to-use reports. Yes, Helical Insight offers canned reporting as part of its standard feature set, helping users get insights quickly without manual report creation.
Is Helical Insight suitable for embedded analytics?
Yes, Helical Insight is highly suited for embedded analytics. Its white-labeling capabilities, customizable frontend, and developer APIs make it ideal for integrating reports into third-party applications.
What type of support is available for Helical Insight?
Helical Insight offers both community and enterprise support. With the enterprise edition, users get direct support from core developers, timely updates, and custom feature implementation.
