From version 5.2.3 of open source BI product Helical Insight, trend card has been introduced. In this blog we will learn how to create a Trend Card. It is important that you have read how to create a Card before you learn how to create a trend card.

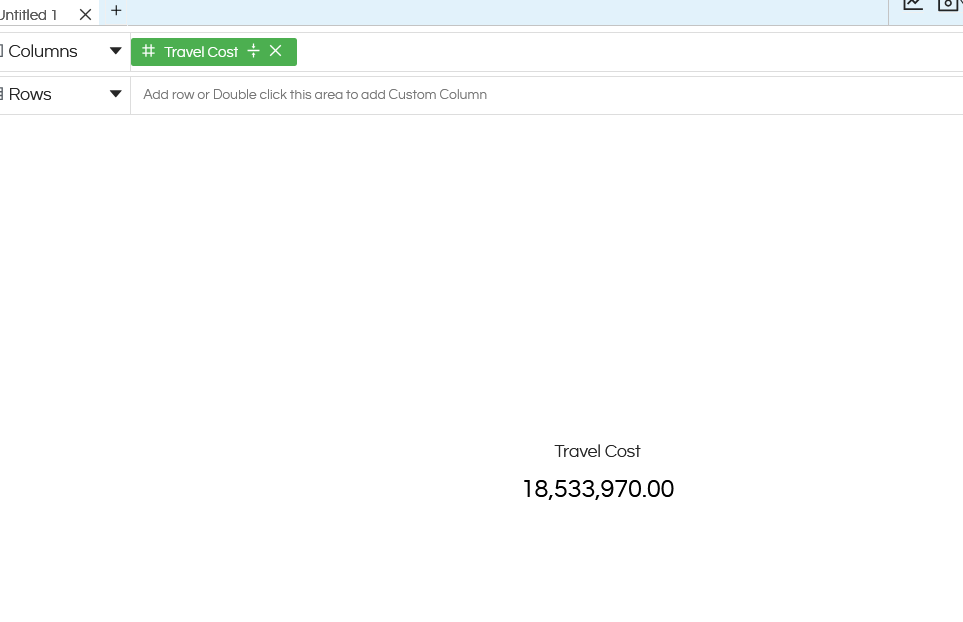
Let us assume that you have created a Card widget like this which is showing a Travel Cost card widget as shown below.

TREND CARD

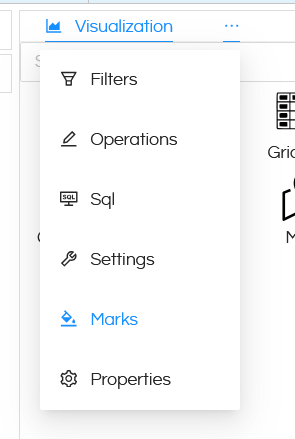
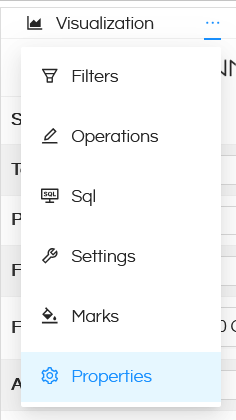
Now go to Marks by clicking on the 3 dots next to Visualization.

TREND CARD

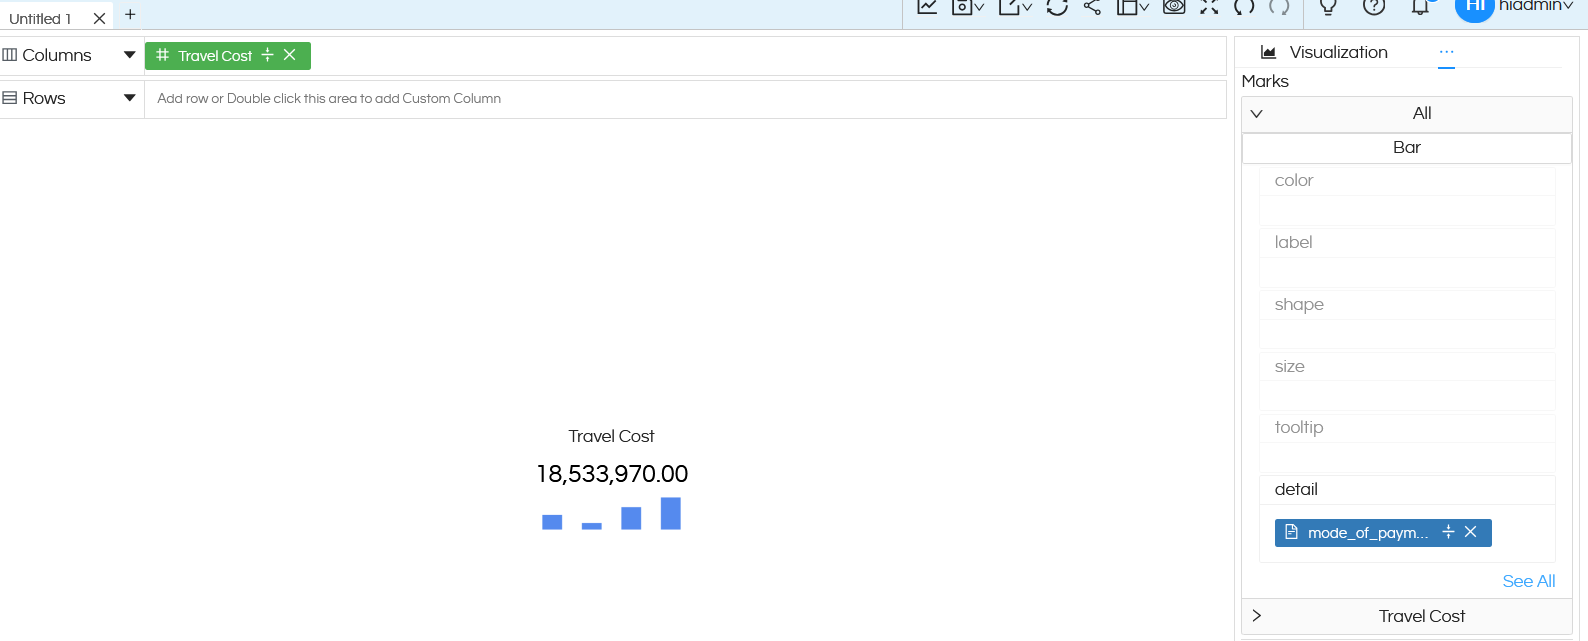
Then you can add a field in the Details. In this case we have added a field called as Mode_Of_Payment which has got 4 values. And thus 4 bars got added below the Travel Cost.

TREND CARD

You can click on the Bar and this bar chart below Travel Cost card widget can be changed to others also (like Line, Bar, Area, Table). Line, Bar, Area and Table are relevant. With version 5.2.3 a new option called Table is also added which was not present earlier. Clicking on Table will give the output like below.

TREND CARD

Now to convert this into Trends showing change or percentage change, go to Properties by clicking on 3 dots next to Visualization.

TREND CARD

Then click on 3 dots next to Axis and click on Card. Many of the card customization options we have already covered in this blog. With version 5.2.3, 2 new options have been introduced as shown and described below.

TREND CARD

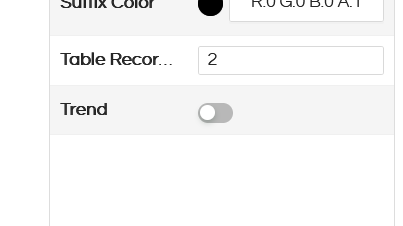
Table Records: Right now you could see that the table below card widget showed 2 values. By changing the values here, it can show more values also. By putting value as -1 it will show all the values.

TREND CARD

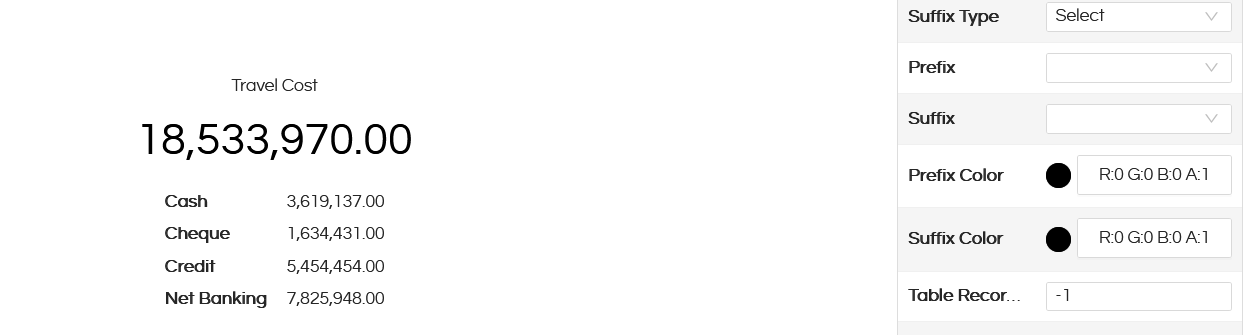
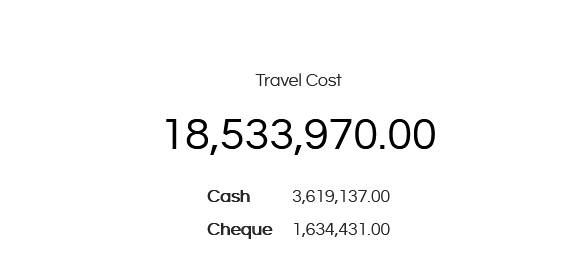
Trend: Right now the values which are appearing are absolute values. That means the cost of travel is total and then below that it is showing a table breakdown according to the Mode_of_Payment (field which was dragged in the Details section).
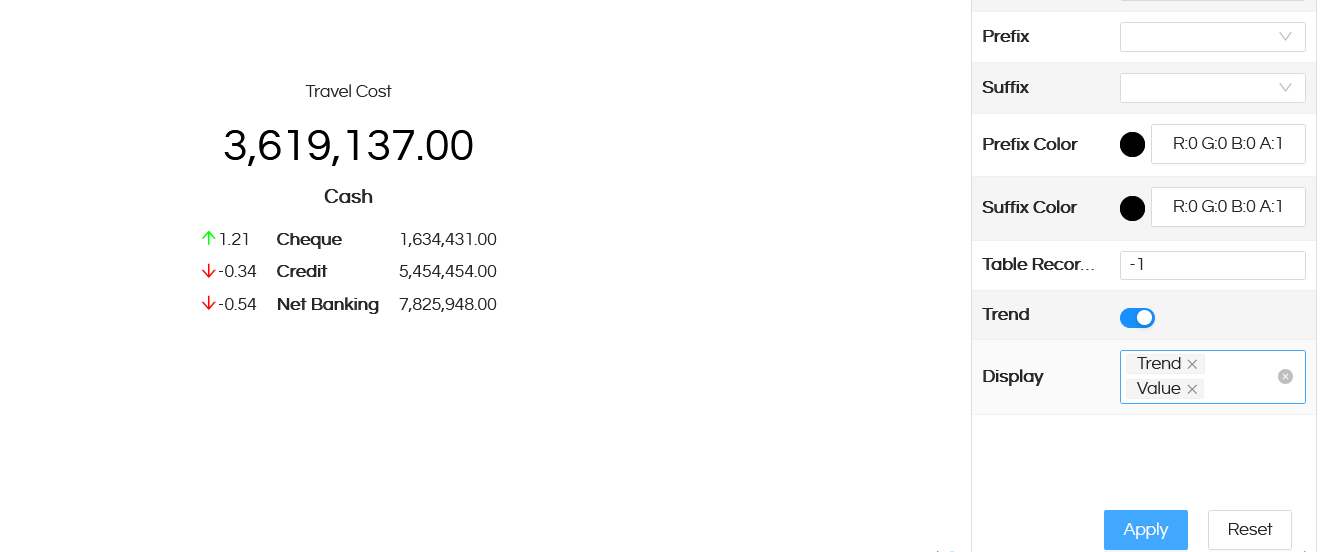
But by enabling the Trend option it will show the first value of the table as top and then the other values will be shown as table below it. You can select to display Trend or Value or both. In this example the first value is shown Cash (whose value is 3,619,137) and the other values comes in the table. We can also see by how many times/percentage the value of Cash is more/less as compared to other values of the table.

TREND CARD

In case if you would like to see those change values as percentage (like instead of 1.21 it should be visible as 121 %), then select the Format property by clicking on the 3 dots next to Axis option.

TREND CARD

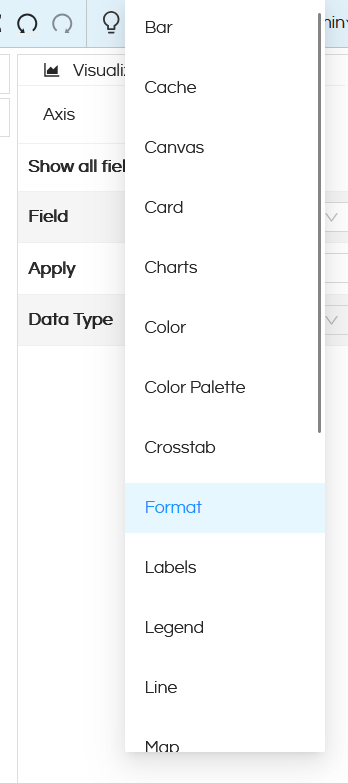
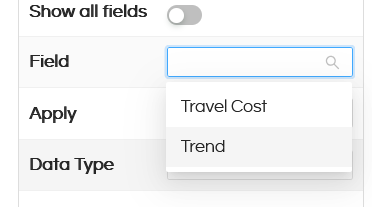
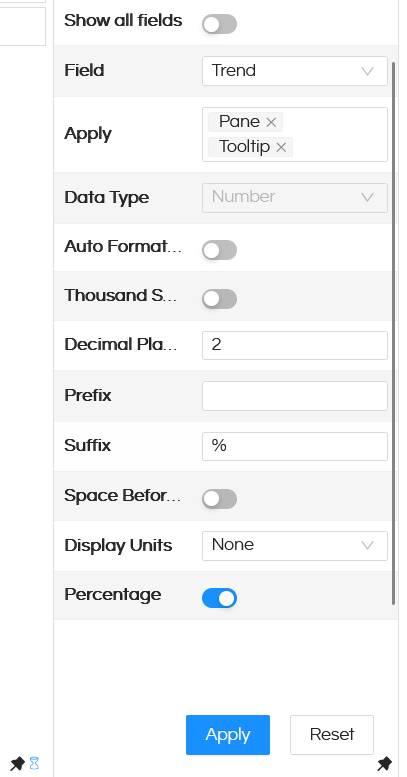
Then from Field select Trend option. You can then enable Percentage. There are also other options like Prefix, Suffix and many other Formatting properties which are present which can be used. To read about the various Formatting properties click here.

TREND CARD

TREND CARD

Now the visualization appears like below.

TREND CARD

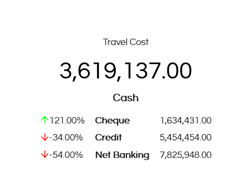
Reading the Card Trend & Explanation of the percentage:
Value of Cash = 3,619,137
Value of Cheque = 1,634,431
We can read this as Cash value is 121% more than Cheque value, 34% less than Credit value and 54% less than Net Banking Value.

Leave a Reply

Helical Insight’s self-service capabilities is one to reckon with. It allows you to simply drag and drop columns, add filters, apply aggregate functions if required, and create reports and dashboards on the fly. For advanced users, the self-service component has ability to add javascript, HTML, HTML5, CSS, CSS3 and AJAX. These customizations allow you to create dynamic reports and dashboards. You can also add new charts inside the self-service component, add new kind of aggregate functions and customize it using our APIs.
Helical Insight, via simple browser based interface of Canned Reporting module, also allows to create pixel perfect printer friendly document kind of reports also like Invoice, P&L Statement, Balance sheet etc.
If you have a product, built on any platform like Dot Net or Java or PHP or Ruby, you can easily embed Helical Insight within it using iFrames or webservices, for quick value add through instant visualization of data.
Being a 100% browser-based BI tool, you can connect with your database and analyse across any location and device. There is no need to download or install heavy memory-consuming developer tools – All you need is a Browser application! We are battle-tested on most of the commonly used browsers.
We have organization level security where the Superadmin can create, delete and modify roles. Dashboards and reports can be added to that organization. This ensures multitenancy.
A first-of-its-kind Open-Source BI framework, Helical Insight is completely API-driven. This allows you to add functionalities, including but not limited to adding a new exporting type, new datasource type, core functionality expansion, new charting in adhoc etc., at any place whenever you wish, using your own in-house developers.
It handles huge volumes of data effectively. Caching, Pagination, Load-Balancing and In-Memory not only provides you with amazing experience, but also and does not burden the database server more than required. Further effective use of computing power gives best performance and complex calculations even on the big data even with smaller machines for your personal use. Filtering, Sorting, Cube Analysis, Inter Panel Communication on the dashboards all at lightning speed. Thereby, making best open-source Business Intelligence solution in the market.
With advance NLP algorithm, business users simply ask questions like, “show me sales of last quarter”, “average monthly sales of my products”. Let the application give the power to users without knowledge of query language or underlying data architecture
Our application is compatible with almost all databases, be it RDBMS, or columnar database, or even flat files like spreadsheets or csv files. You can even connect to your own custom database via JDBC connection. Further, our database connection can be switched dynamically based on logged in users or its organization or other parameters. So, all your clients can use the same reports and dashboards without worrying about any data security breech.
Our application can be installed on an in-house server where you have full control of your data and its security. Or on cloud where it is accessible to larger audience without overheads and maintenance of the servers. One solution that works for all.
Different companies have different business processes that the existing BI tools do not encompass. Helical Insight permits you to design your own workflows and specify what functional module of BI gets triggered