From version 5.2.3 of Open Source BI Helical Insight a new category of charts have been introduced called as Relation Chart. This relation chart can allow you to create charts like Sunburst Chart, Sankey Chart, Treemap charts and Circle Packing charts.

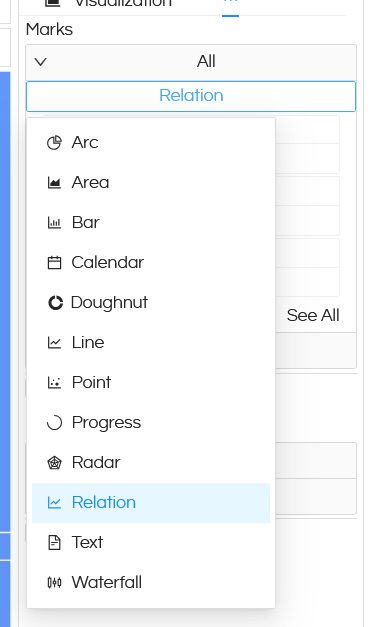
In this blog we will learn how to use Relation chart. You can drag the required dimensions and measures and click on Charts. Go to Marks and in that in the drop down you can see one more additional option called Relation. Note that these Relation chart options only appears in case of Charts and not Grid Charts.

Usage of Relation Charts

By default it creates a Treemap chart like below. Other functionalities like Marks, Interactivity, Filtering, etc can also be used.

Usage of Relation Charts

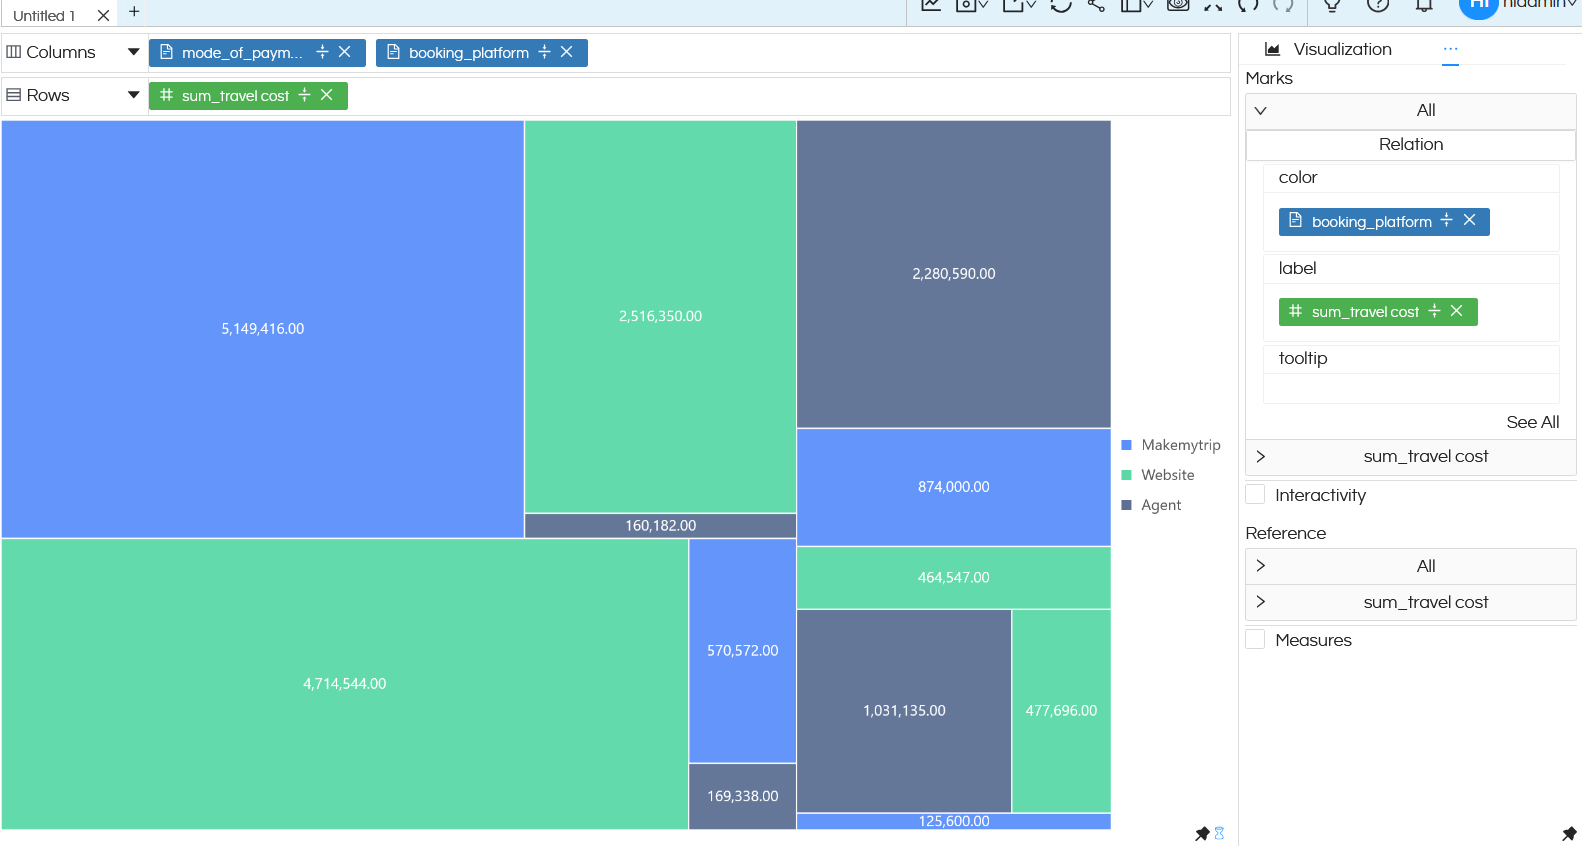
A treemap chart needs at least 1 dimension and 1 measure. You can put anything in Rows and Columns.

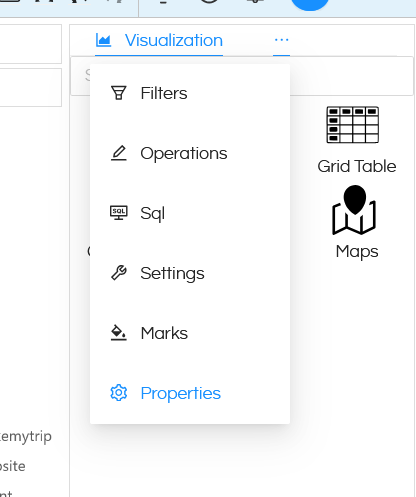
Now click on Properties by clicking on the 3 dots next to Visualization.

Usage of Relation Charts

Then click on 3 dots next to Axis and go to properties of Relation chart.

Usage of Relation Charts

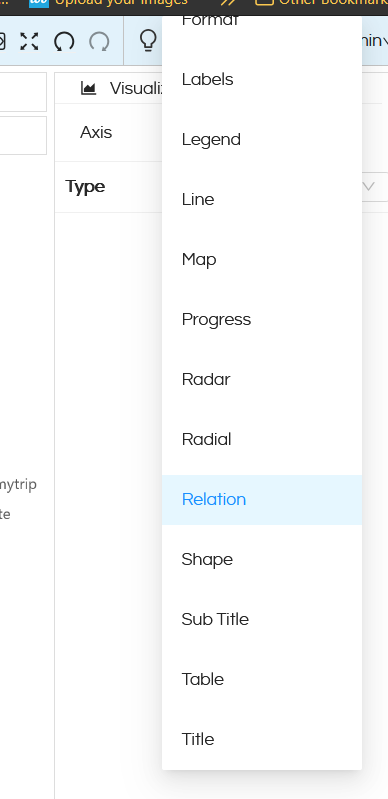
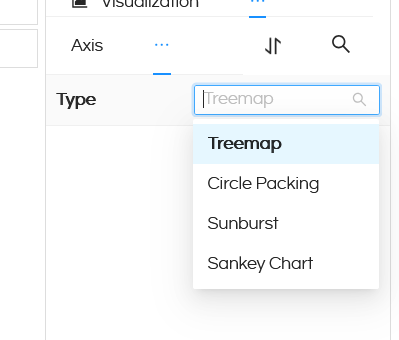
Over here, you will get an option to switch which kind of relation chart that you would like to see.

Usage of Relation Charts

In the above snapshots we have already seen how Treemap chart looks like.

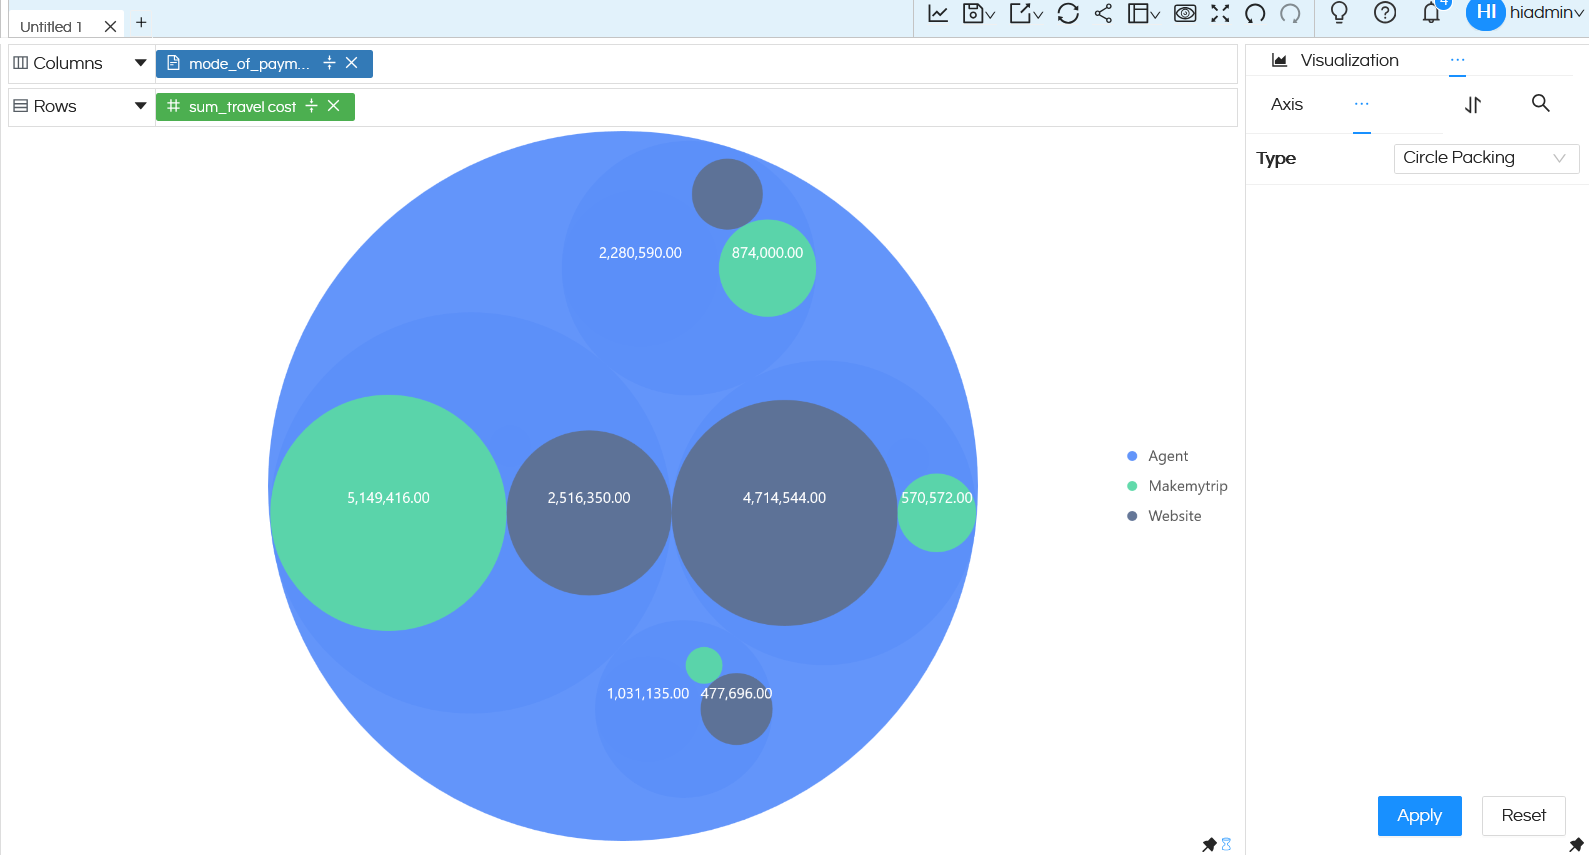
Circle Packing: Below is an example of Circle packing chart. This can also have multiple dimensions. Other features like Marks, interactivity, formatting etc options can also be used.

Usage of Relation Charts

Sunburst Chart: Below is an image of sunburst chart. You can have multiple dimensions which can create multiple hierarchies. Other features like Marks, interactivity, formatting etc options can also be used.

Usage of Relation Charts

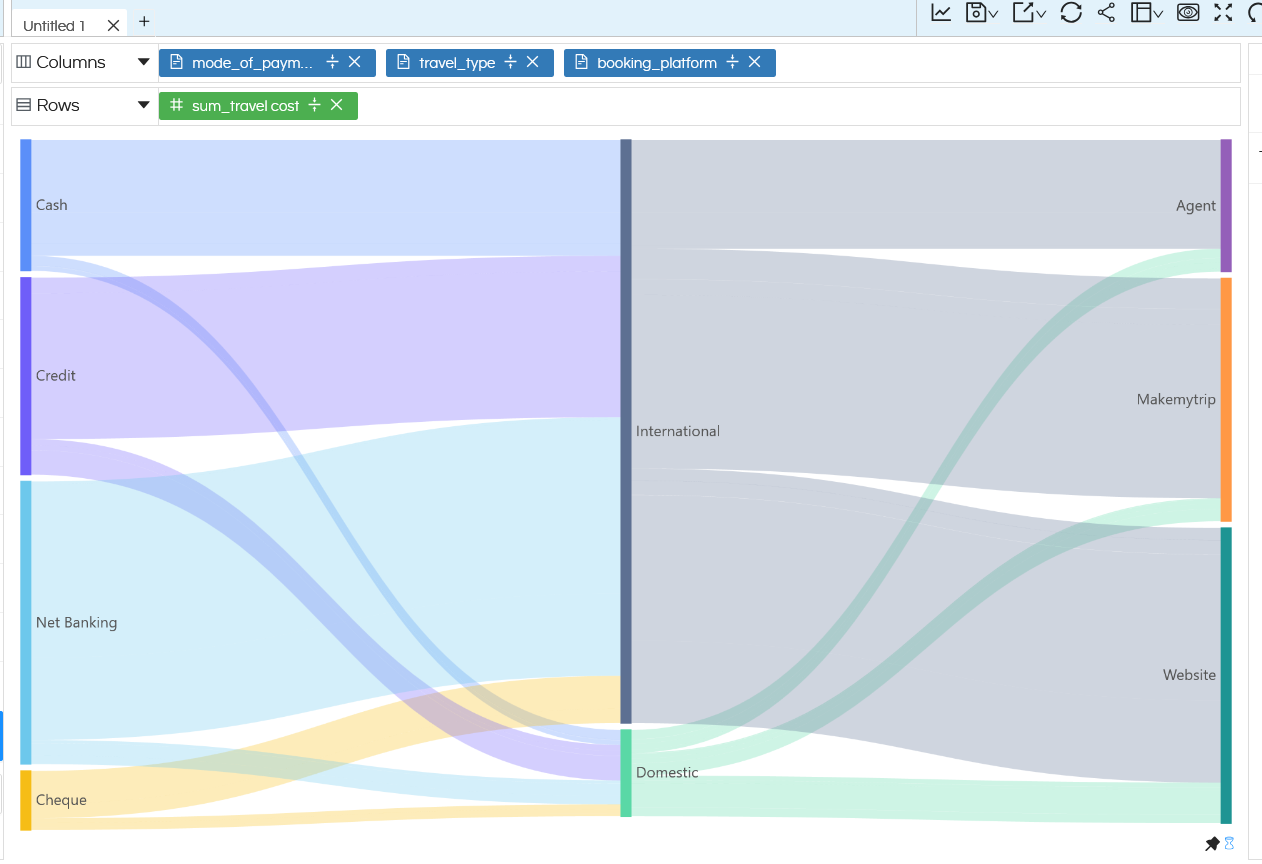
Sankey Chart: Below is a snapshot of a sankey chart. Other features like Marks, interactivity, formatting etc options can also be used.

Usage of Relation Charts

Leave a Reply

Helical Insight’s self-service capabilities is one to reckon with. It allows you to simply drag and drop columns, add filters, apply aggregate functions if required, and create reports and dashboards on the fly. For advanced users, the self-service component has ability to add javascript, HTML, HTML5, CSS, CSS3 and AJAX. These customizations allow you to create dynamic reports and dashboards. You can also add new charts inside the self-service component, add new kind of aggregate functions and customize it using our APIs.
Helical Insight, via simple browser based interface of Canned Reporting module, also allows to create pixel perfect printer friendly document kind of reports also like Invoice, P&L Statement, Balance sheet etc.
If you have a product, built on any platform like Dot Net or Java or PHP or Ruby, you can easily embed Helical Insight within it using iFrames or webservices, for quick value add through instant visualization of data.
Being a 100% browser-based BI tool, you can connect with your database and analyse across any location and device. There is no need to download or install heavy memory-consuming developer tools – All you need is a Browser application! We are battle-tested on most of the commonly used browsers.
We have organization level security where the Superadmin can create, delete and modify roles. Dashboards and reports can be added to that organization. This ensures multitenancy.
A first-of-its-kind Open-Source BI framework, Helical Insight is completely API-driven. This allows you to add functionalities, including but not limited to adding a new exporting type, new datasource type, core functionality expansion, new charting in adhoc etc., at any place whenever you wish, using your own in-house developers.
It handles huge volumes of data effectively. Caching, Pagination, Load-Balancing and In-Memory not only provides you with amazing experience, but also and does not burden the database server more than required. Further effective use of computing power gives best performance and complex calculations even on the big data even with smaller machines for your personal use. Filtering, Sorting, Cube Analysis, Inter Panel Communication on the dashboards all at lightning speed. Thereby, making best open-source Business Intelligence solution in the market.
With advance NLP algorithm, business users simply ask questions like, “show me sales of last quarter”, “average monthly sales of my products”. Let the application give the power to users without knowledge of query language or underlying data architecture
Our application is compatible with almost all databases, be it RDBMS, or columnar database, or even flat files like spreadsheets or csv files. You can even connect to your own custom database via JDBC connection. Further, our database connection can be switched dynamically based on logged in users or its organization or other parameters. So, all your clients can use the same reports and dashboards without worrying about any data security breech.
Our application can be installed on an in-house server where you have full control of your data and its security. Or on cloud where it is accessible to larger audience without overheads and maintenance of the servers. One solution that works for all.
Different companies have different business processes that the existing BI tools do not encompass. Helical Insight permits you to design your own workflows and specify what functional module of BI gets triggered