From version 5.2.3 of Open Source BI product Helical Insight, there are some properties options added which can allow to create charts like Rose Charts, Radial Bar chart. In this blog we will learn how to use such kind of options to create such kind of advanced charts.
NOTE: These kind of options are only present in Charts and not Grid Charts.
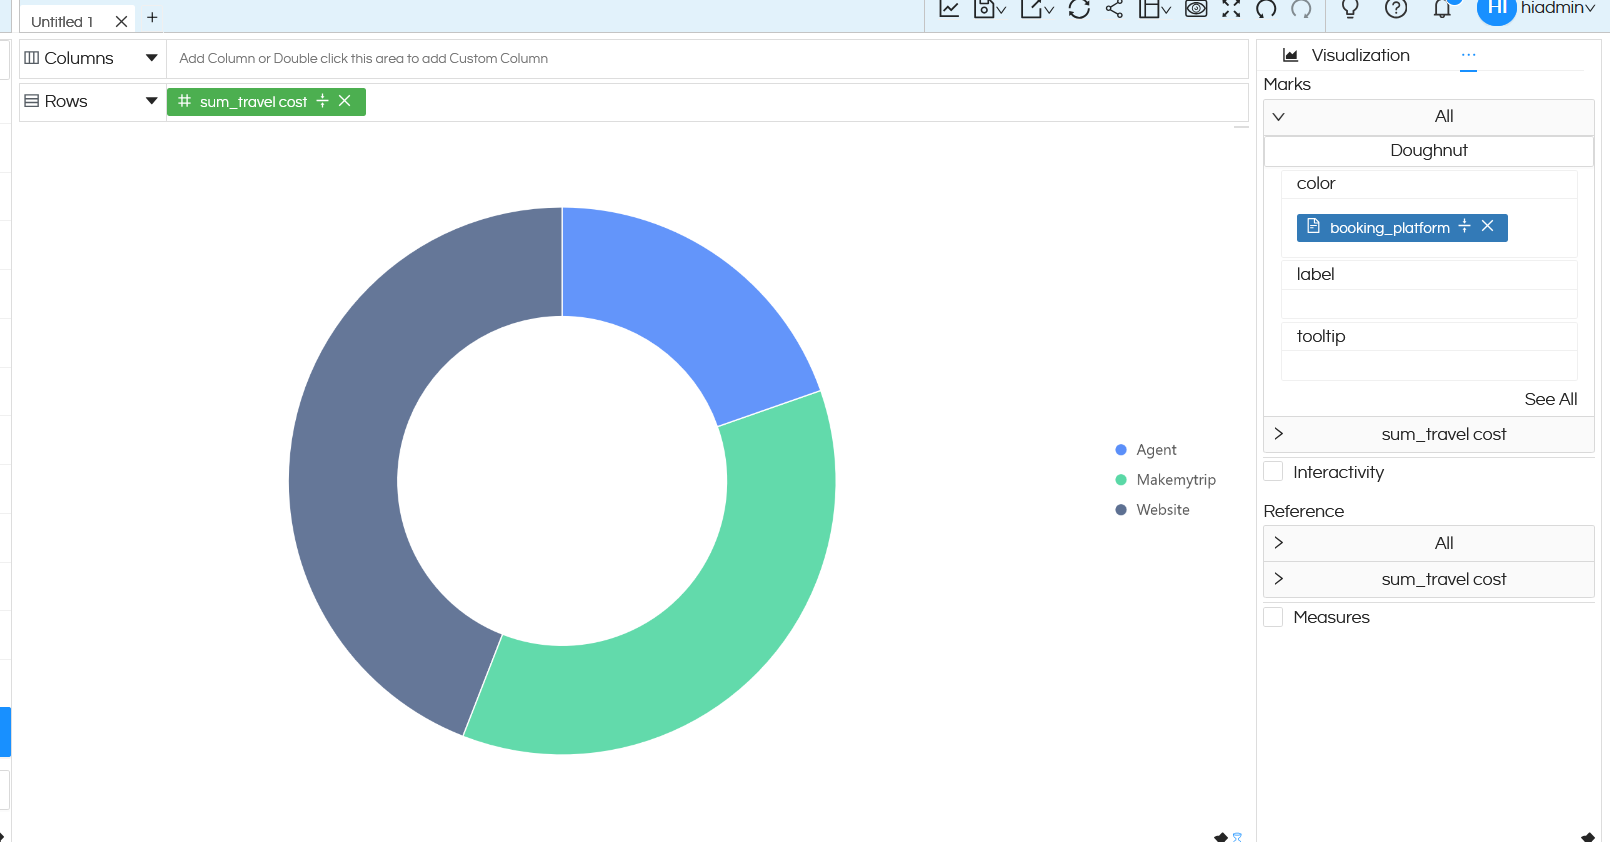
Step 1: is to create a normal Arc/Pie chart or Donut chart as shown above (click here to learn how to create pie or donut charts using Charts). You can refer to our other blogs to learn how to create an Arc/Pie chart or donut chart of the Charts category. Refer above image.
Step 2: Click on the 3 dots next to Visualization and go to Properties section.

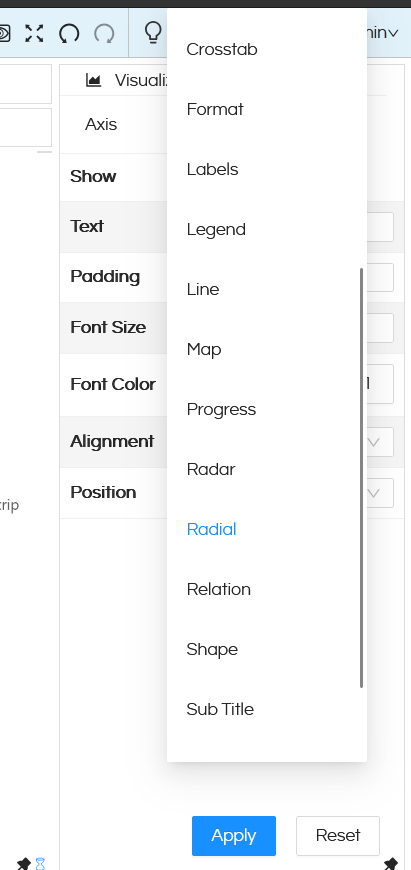
Step 3: When the Properties option appears, click on the 3 dots next to Axis and go to the Radial option.
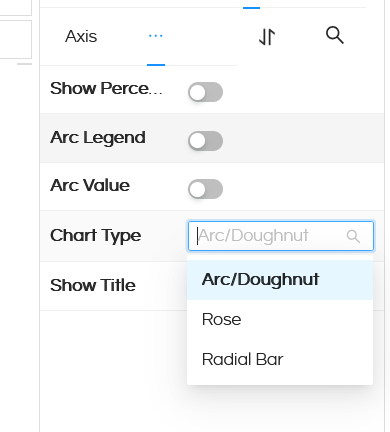
Step 4: With version 5.2.3 you will see a new option called Chart Type. Clicking on it will give you options like Rose and Radial Bar.
Rose chart: Rose chart needs one dimension in Rows/Columns area. A dimension can be put in the Color section of the Marks. Other features like Marks, interactivity, formatting etc options can also be used.
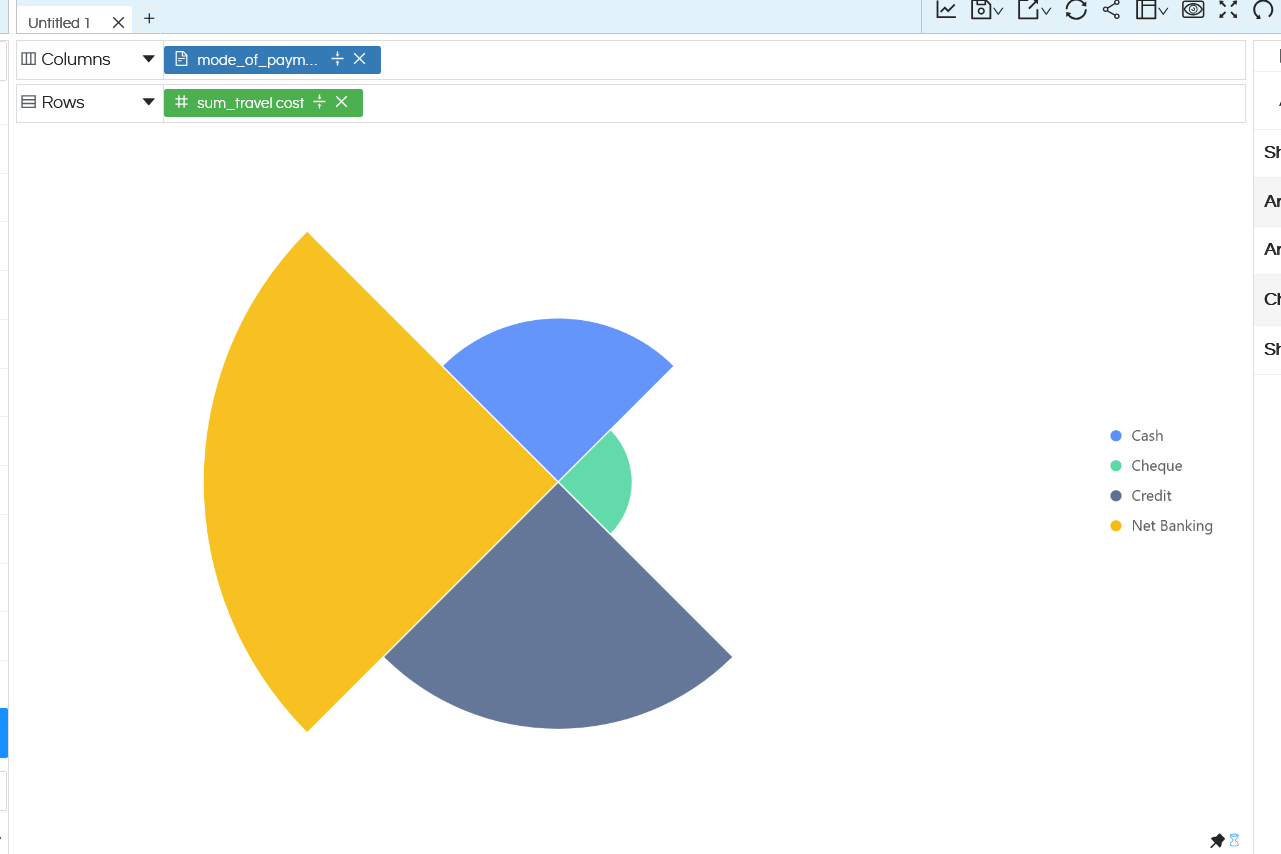
Radial Bar: Below is an example of Radial Bar chart.
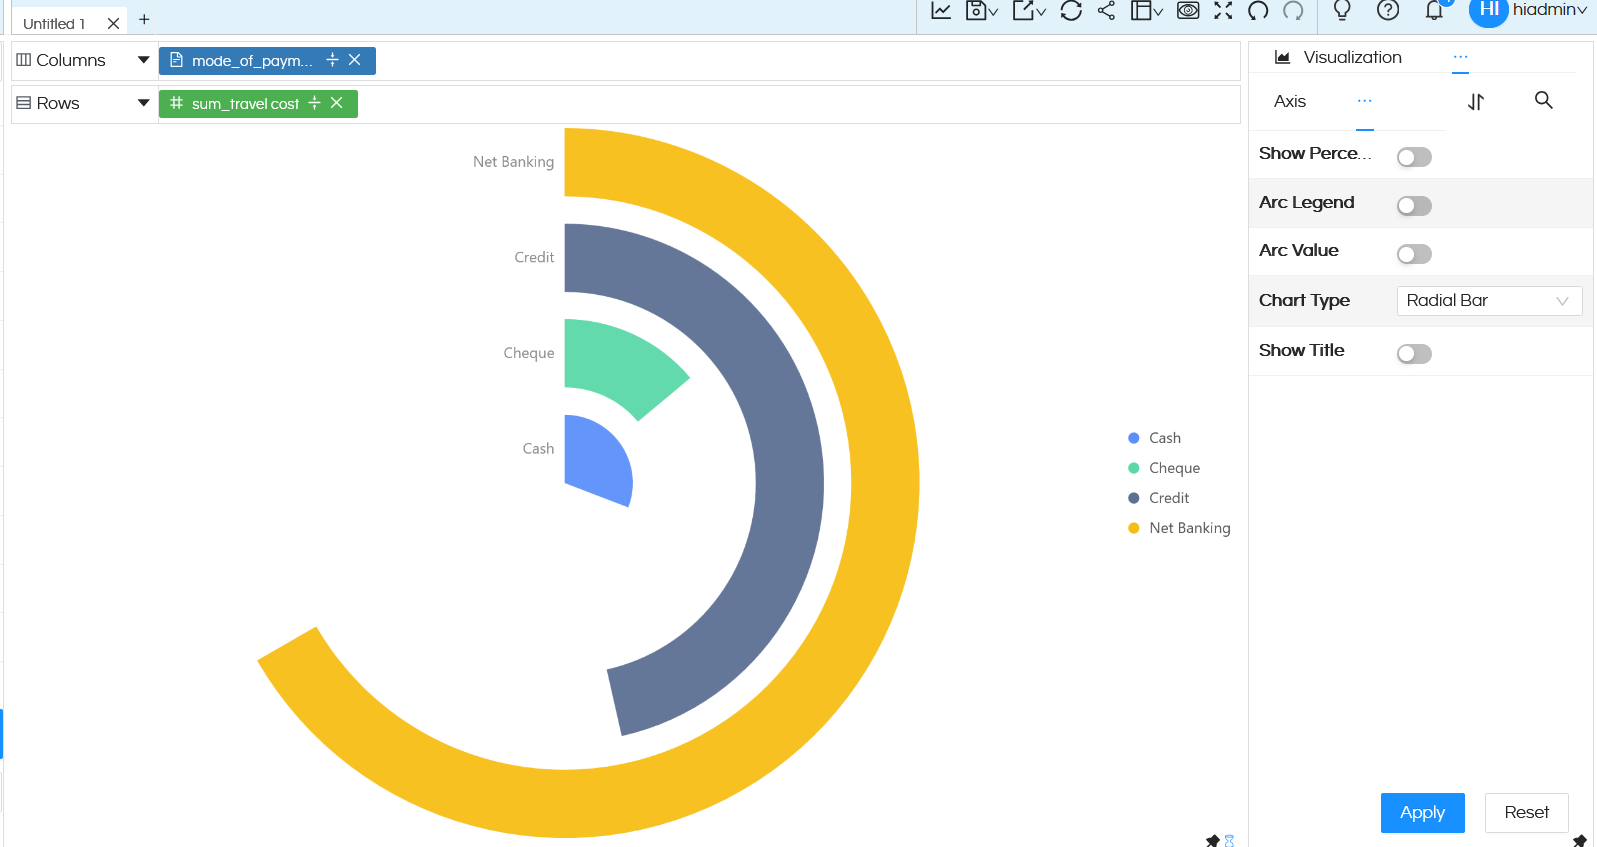
NOTE: The other options like Show Percentage, Arc Legend, Arc Value, Show title are only applicable to Donut charts and Pie charts. Click here to learn more about these properties.