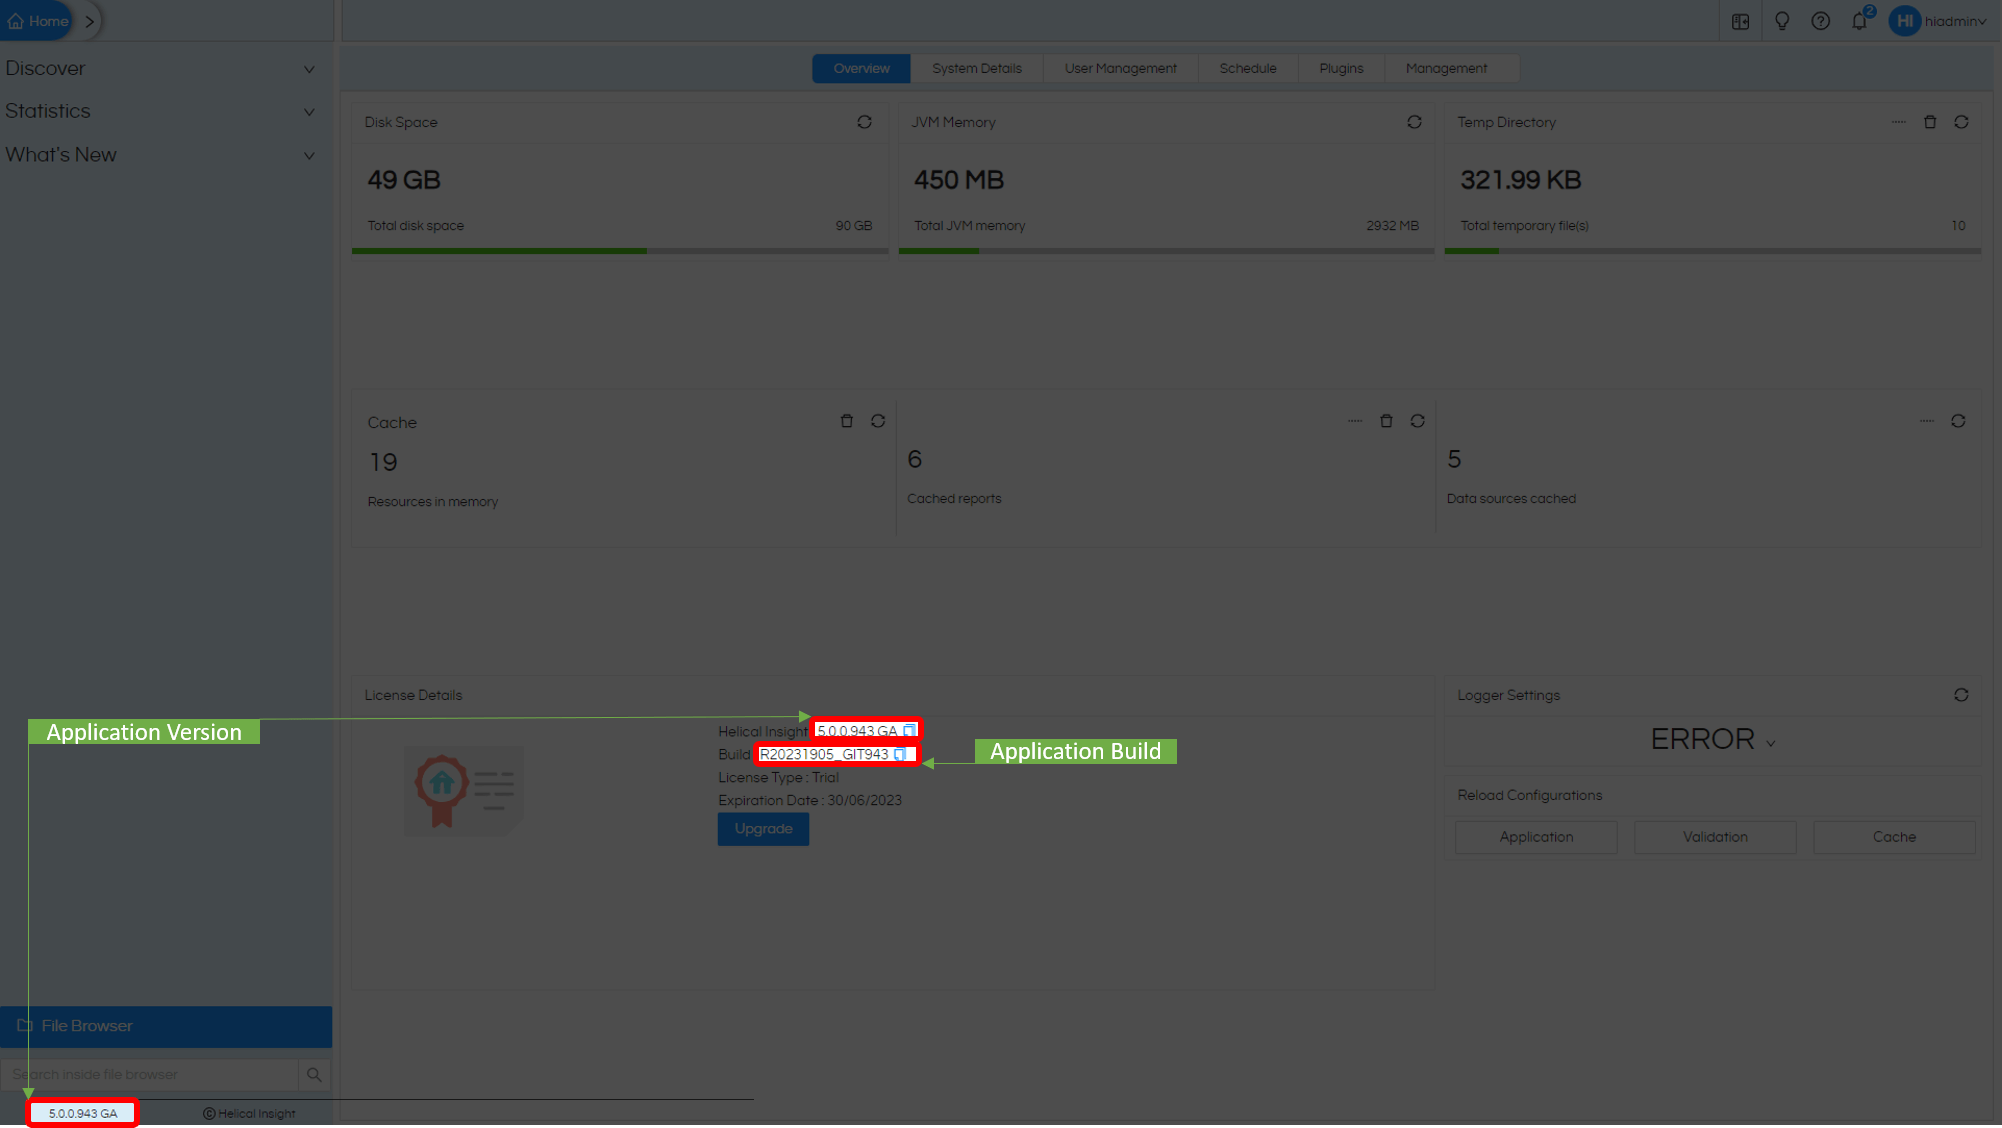
We have recently released the GA version of Helical Insight 5.0 in May 2023 after success of RC2 version short while ago. It has been a long road and many functionalities as well as user experience has improvised and standardised since last version. In this blog, we will cover the major changes that our new version 5.0 has implemented. If you have recently registered and downloaded, please ensure that you have the latest version. This can be seen at the bottom left of your screen or on your admin home page as shown in image below

This will be one of the major releases and will try to bring a paradigm shift in how people see open-source BI products compared to proprietary BI products.
Let us get started.
- Included with GA Release: build code R20231905_GIT943
- Exist in Snapshot version
Basic Architecture and UI experience
The entire application interface is built as SPA (Single Page Application) with the latest upgraded React Framework and Ant design UI libraries. Being a single web page application, navigation across different pages is much faster. Usage of AntD for building all the modules gives a very consistent user experience. All the modules have undergone user experience improvements based on the user feedback we have been receiving.
Shift to Database
Till now, everything that was earlier saved as physical files in the drive (reports, dashboard, metadata, canned reports, community reports, etc.). With version 5.0 and from now on, everything will be saved in a database. Even the default database, which is Derby (which comes along with the product), is configurable, and you can use any RDBMS DB of your choice.
This facility makes the application faster and better in performance and has more concurrency; it will also allow us to start providing robust logging and auditing capabilities in the product.
All-new ‘Reports’
A new reporting interface has been introduced, making the entire process of creation of visualization reports with filtering and drill-down capabilities a breeze. This more recent version allows below
- Much awaited Undo and Redo options are available, along with keyboard shortcuts
- Advanced customization on visualizations including
- Adding report Titles and Subtitles
- Customizing color of charts and tables: specific for certain value or ranges
- Customization of axis charts to make it a grouped, stacked or percentage bar charts
- Repositioning Legends or turning them off completely.
- Separate rows and columns section
- Includes single information card widget visualization including mini charts
- Visualizations like Word Cloud have also been added.
- Tableau kind of Grid kind of charting interface support
- Ability to specify color, size, label, tooltip, shape, and many more properties to add another dimensions to the charts
- Convert data point formats for numbers and dates and appear in a way that make more sense to you.
- Setting cache duration for report data
- Implemented JS, HTML and CSS support on report level also
- JS can be used based on query status as Pre Execution, Pre Fetch, Post Fetch and Post Execution

- Single click option for implementing drill down and drill through
- Filters with advanced options for controlling and configuring Display & Value
- UI-driven cascading filters
- Support for dynamic views for advanced filtering
- Date /date time filters with prebuilt functions and date ranges
- Concept of relative dates is included with features of date ranges like next 3 months, past year, last 15 days etc.
- Autosuggestion-based application of DB functions
- A better option for selecting date picker, date range picker, slider,
- Options like Hide, and Hide and Include in the result-set and much more.
- Various customizations on chart Properties
- Adding titles and sub-titles
- Changing cache duration
- Various formatting options for date, time, date-time and number fields
- Altering the colors of the charts
- Modifying axis charts as stacked, grouped or percentage charts
- Applying percentage calculations on radial charts
- Modifying legend positioning
- Customize lables according to your needs
- Control axes of your charts
- For crosstab reports enable Grand total and Sub total esaily
All-new ‘Dashboard’ designer
The new dashboard designer module allows for the creation of dashboards very quickly.
- Dashboards now includes Inter Panel communication by default. Any panel with interactivity will listen to drill down in any of the reports.
- Ability to add image and text component
- Much awaited Undo and Redo options are available, along with keyboard shortcuts
- Dashboards support groups for better layout designing, groups can be further nested inside a group giving you enough flexibility for organizing the dashboard.
- Single click option of adding filters. All panels that share the filter can listen to the filter without any additional effort.
- Additional filter level settings for its position, enable Apply button, etc.
- Additional options like pin, exporting, maximizing, editing, etc.
- Dashboard designer level settings like grid settings, size settings, and various other configurable options
- Apply customizations like header, shadow, background color, border
- Additional features like borders with rounded corners, and specific to a side as per need
- Apply advanced options like HTML, CSS, JS etc.
- Introduction of new Liquid Template language makes your text more interactive to the viewers
Export Import Utility
With the version 5.0 GA version, there is an export import utility which can allow users to move file (reports, dashboard, metadata) from one server into another via a UI driven option. Thus migration from one server to another server (like development to production) is much more simpler.
Revamp of File Browser.
The File Browser had undergone a major change on UI design and has been made more user friendly. This includes
- Easy searching: As the application goes large, you do not need to find needle in haystack
- Filters type of files: making it easier to locate your file
- Rearrange the view: Change the folder structure into a File-Type structure, and all your files will be shown as per categories or vice-versa. You can also choose the columns you want to see.
- Right-click functionality is also improvised for a better user experience.
- Sharing of files have been made simple and easy
- Easy to move files now by Exporting the folder and Importing on new server.
- You can now create a new folder and also make it public from the file browser itself.
Revamp of Data-Sources
New databases supported in-built Databricks, Athena, Elastic Search, Snowflake etc.along with what we already had and more and more data sources are in the pipelineand more and more data sources are in the pipeline. Let us know if you need the support of any DB; we can make our product compatible with new data sources within a week.
The whole look and GUI has been revamped as per the new architecture. It matches the interface and design like other modules.
- New Databases supported: Databricks, Athena, ElasticSearch, Snowflake, TrinoDB.
- Databases: classic Relations DBMS are all usable as they always have been including Columnar databases, presto, IBM DB2; DW appliances like vertica; no-SQL DBs like elastic search, and a lot more.
- Flat files: support flat files like spreadsheets or csv files.
- Custom JDBC driver: you can make up your own JDBC driver and use it
- Middleware: where we use an additional middleware to connect to databases like DreamIO, Apache Drill, Presto etc.
- Dynamic DB Switching: where metadata, reports and dashboard remains same and based on the user logging in the underlying DB connection is changed and pointed to DB for specific user based on various conditions.
Revamp of Metadata
UI of metadata has been upgraded to match the current design. UX has been improved as well as known bugs have been fixed.
We shall have another release with In-Memory, cross-DB connections and Cube supports will be added on.
Admin and User Module
The admin and user module has a completely revamped UX with a seamless interface.
- With version 5.0, we are using Chromium instead of Phantom for export.
- Additional options like preview, toggle sidebar
- Revamped UX of user role management
- Easy application of filters
What’s next?
We are just getting started. Being a major release with a lot of back-end, front-end, and UX-UI changes, this specific release took some time, but rest assured, the subsequent releases will come faster.
We have a very strong product roadmap which includes
– A lot of inbuilt additional data sources support
– A lot of new charts and customization options
– Addition of canned report and community report module in this new release
– Support of in-memory (akin extract) and cubes
– NLP-driven method of reports (ask questions to data in the English language, get answers in the form of reports)
– Directly supported advanced statistical and scientific algorithms
– UI-driven workflow method
– Data pipelines
Your feedback is valuable to us. Please reach out on support@helicalinsight.com
Thank you
Team Helical
Register now to try out the product at your end.
